Why Technical Analysis Works in the Age of Algo Trading?
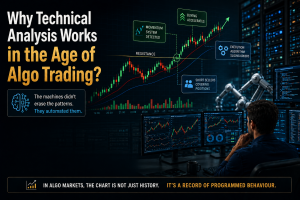
A stock breaks above resistance. Within seconds, buying accelerates. A momentum system detects the move, an execution algorithm starts slicing orders, short sellers begin covering and the price moves even further.
Then comes the irony: the machines that were supposed to make traditional technical analysis obsolete may be helping create the very patterns that technical analysts study.
As algorithms take a larger share of market activity, trading is becoming faster and more systematic. But speed has not eliminated human behaviour, liquidity constraints or recurring reaction to price movements. It has simply automated many of them.
That raises a more interesting question than whether technical analysis “works”: what happens to technical signals when an increasing share of the market is responding to the same signals algorithmically?
The answer is not every moving-average crossover or chart pattern suddenly becomes profitable. It is that the role of technical analysis is changing, from trying to predict prices to understanding the behaviour, positioning and market structure that produce them.
In an algorithmic market, the chart may no longer be just a picture of what traders did.
It may also be a record of what their machines were programmed to do.
If Machines Trade On Data, Why Do Charts Still Matter?
The growth of algorithmic trading creates an obvious challenge for technical analysis: if computers can identify patterns faster than humans and execute trades without hesitation, shouldn’t any easily recognizable pattern disappear?
The answer depends on what we mean by a “pattern”. A moving-average crossover is simply a mathematical transformation of price. Momentum measures persistence in returns. Volume measures participation. Volatility measures the intensity of price movement. None of these variables disappear because a computer is calculating them.
In fact, algorithmic trading has made these variables more important to the market’s functioning. NSE data shows that algorithmic trading accounted for 55% of equity-cash turnover in FY26, while its share of equity-derivatives turnover reached 70% in FY25.
But high algo participation does not prove that algorithms create technical patterns. The more defensible argument is that systematic trading increasingly responds to measurable market conditions. When multiple strategies react to momentum, volatility, liquidity or order-flow changes, their trades become part of the price formation process.
So the modern technical analyst is not trying to beat machines at speed. The objective is to understand what the machines, institutions and discretionary traders are collectively doing to price.
Technical Analysis Was Never Really About Drawing Lines
Much of the criticism of technical analysis focuses on chart formations: triangles, head-and-shoulders patterns, support levels and resistance zones. That makes the discipline look subjective.
But the more measurable part of technical analysis is different. It converts market behaviour into rules based on variables such as:
- Price momentum
- Volatility
- Trading volume
- Trend persistence
- Breakouts
- Mean reversion
- Relative strength
These variables exist regardless of whether the trader is human or algorithmic.
Research has repeatedly found evidence that past returns can contain information about future returns under particular conditions. A study of 58 futures and forward contracts across equity indices, currencies, commodities and sovereign bonds, covering more than 25 years, found positive predictability from an instrument’s own past returns. The researcher described this as “time-series momentum” and found that the effect persisted for roughly a year before partially reversing over longer horizons.
That matters because momentum is essentially a statistical version of trend following.
The useful distinction, therefore, is between technical analysis as visual interpretation and technical analysis as systematic measurement.
The former can be subjective. The latter can be coded, tested and executed by machines.
And once technical rules become programmable, the arrival of algorithmic trading does not necessarily destroy them. It can make them more systematic.
Not All Algorithms Trade The Same Way
Calling something “algo trading” hides an important distinction. An algorithm that decides what to trade behaves very differently from one that decides how to execute an existing order.
Three categories matter for technical analysis:
- Signal-generating algorithms actively search for trading opportunities. Trend-following and momentum systems can respond to persistent price movements, while mean-reversion strategies look for deviations from historical relationships. These are the algorithms most directly connected to technical signals.
- Execution algorithms such as VWAP, TWAP and participation strategies usually do something different. An institution has already decided to buy or sell; the algorithm determines how to spread that order across time and available liquidity. It is not necessarily predicting a breakout.
- Market-making algorithms continuously adjust quotes according to factors including inventory, volatility and order-book conditions. They influence liquidity rather than simply following a chart pattern.
This distinction matters because it prevents an exaggerated claim: not every algorithm is reinforcing momentum.
The stronger argument is narrower. When signal-generating strategies respond to similar conditions, their orders can become correlated. Meanwhile, execution algorithms can determine how those institutional orders interact with liquidity.
The technical chart records the final result of these interactions. Check our latest video for more details.
The Six-Variable Framework For Reading A Technical Signal
A modern technical signal should not be read in isolation. Instead, examine it through six connected variables:
Price → Volume → Volatility → Liquidity → Positioning → Catalyst
- Price: Is the market actually changing trend, or is the move still trapped inside an established range?
- Volume: Is participation expanding alongside the price move? A breakout on unusually weak participation deserves less confidence than one accompanied by substantial activity.
- Volatility: Is volatility expanding because expectations are changing, or has the stock simply become noisy?
- Liquidity: How much trading activity is available around the current price? A thin market can move sharply without representing broad conviction.
- Positioning: Who is likely to be forced to act if the price continues moving? Short covering, stop-losses and hedging can accelerate an existing move.
- Catalyst: Is there new information explaining why the market is repricing the asset?
This framework changes the role of technical analysis. Instead of asking whether an indicator says “buy”, the trader asks whether multiple pieces of market evidence point in the same direction.
Consider a stock breaking above ₹1,000 after trading below that level for weeks. A traditional chartist sees a breakout. A modern trader asks whether volume has expanded, whether liquidity is sufficient, whether volatility is rising constructively and whether a catalyst explains the repricing.
This distinction matters because order-flow research shows that short-term price changes are closely related to order-flow imbalance, with the impact depending on available market depth.
The lesson is simple: ₹1,000 is only the level. The behaviour surrounding the level is the signal.
That is where technical analysis becomes more than pattern recognition.
What Technical Signals Have Become Commoditised?
The rise of systematic trading has not made every technical indicator useless. It has made the simplest versions easier to compete away.
A signal is particularly vulnerable when it is:
- Easy to calculate
- Widely published
- Easy to back-test
- Easy to automate
- Used without market context
That makes a standalone moving-average crossover, a basic RSI overbought reading or a single candlestick pattern a weak foundation for a trading strategy.
This does not mean these indicators have no information content. It means their information is unlikely to be exclusive.
The distinction is important. A 50-day moving average crossing above a 200-day moving average tells the market something about the recent price trend. But thousands of traders and machines can calculate the same crossover simultaneously.
The more interesting signals are those requiring multiple dimensions of information.
Momentum combined with volume is more informative than momentum alone. A breakout combined with order-flow and liquidity information tells more than the price crossing a horizontal line. Volatility regimes can alter the meaning of the same momentum signal.
Research on technical trading has found that the profitability of technical models can decline as markets become more competitive and information gets incorporated faster.
The implication is not to abandon technical analysis.
It is to stop treating simple, universally visible signals as complete strategies.
Where Technical Analysis Still Has An Edge?
If simple signals are increasingly commoditised, what remains useful?
The strongest candidates are signals that capture persistence, participation and market structure rather than merely identifying a price formation.
Momentum remains important because trends can persist over particular horizons. A major study covering 58 futures and forward markets found evidence of time-series momentum across the asset classes examined.
Volume-confirmed price movement can help distinguish broad participation from isolated price changes. Research on Indian equities has found relationships between trading activity and momentum behaviour, particularly among heavily traded securities.
Volatility regimes matter because the same technical setup can behave differently in a low-volatility market and during a volatility shock.
Liquidity and order flow may be even more important for short-term traders. Price does not move simply because a chart pattern exists; it moves when buying and selling pressure interact with available liquidity.
The edge, therefore, is less likely to come from discovering a secret indicator.
It comes from combining signals that describe different parts of the market.
That is why the modern technical trader should think less like a chartist and more like a market-structure analyst.
Why Technical Analysis Still Fails?
None of this means technical analysis automatically produces excess returns.
A historical pattern can disappear once enough traders exploit it. Transaction costs, slippage and taxes can turn a profitable-looking backtest into an unprofitable live strategy. A signal can also work during one market regime and fail completely during another.
This is particularly important in an algorithmic market because strategies can adapt faster than before.
The practical implication is that traders should test three things separately:
- Does the signal have statistical evidence behind it?
- Does the signal survive realistic trading costs?
- Does it continue to work outside the period in which it was discovered?
A technically attractive chart is therefore only the beginning of the analysis.
The strongest technical approach is probabilistic: identify a setup, define the conditions that strengthen or weaken it, establish the risk before entering and continuously reassess whether the original thesis still holds.
Technical analysis is not a forecasting machine.
Its value lies in converting market behaviour into structured probabilities and risk decisions.
The New Technical Analyst Is Not Competing With the Machines
The biggest mistake would be to frame the future as humans versus algorithms.
Humans will never compete with machines on execution speed. Machines will never automatically understand every contextual variable that matters to a discretionary trader.
The more useful division of labour is different.
Algorithms are exceptionally good at processing large datasets, detecting predefined relationships and executing instructions consistently.
A trader’s advantage can instead come from deciding which relationships deserve attention and under what circumstances they should matter.
That is why the future of technical analysis is unlikely to be about adding more indicators to a chart. It is about asking better questions.
A moving-average crossover tells you what price has done. Volume can tell you how much participation accompanied it. Volatility tells you how aggressively expectations are changing.
Liquidity tells you how easily those expectations can move price. Positioning tells you who may be forced to react. A catalyst tells you why the repricing may be happening.
Put together, these variables provide something a single indicator cannot:
a model of why the price is moving, not merely a description of where it has moved.
That is the version of technical analysis most likely to remain useful in an algorithmic market.
Conclusion
Algorithmic trading has changed what technical analysis needs to be. The days when a trader could rely on a single moving-average crossover, an RSI reading or a textbook chart pattern as a standalone edge are increasingly difficult to defend. These signals are easy to calculate, easy to automate and widely available.
But that does not make the chart irrelevant. It changes what the trader should look for in it.
The more durable signals are those that capture persistent behaviour: momentum, participation, volatility, liquidity and order flow. A breakout matters more when the market shows genuine participation behind it. Momentum becomes more meaningful when supported by volume and a change in positioning. Volatility becomes informative when it reflects a genuine repricing rather than random noise.
That is also why the rise of algorithms does not automatically weaken technical analysis. Algorithms process and respond to the same market variables that technical traders observe. Their activity becomes part of the price, volume and liquidity data that eventually appears on the chart.
The real edge, therefore, is no longer spotting a pattern before everyone else.
It is understanding why the pattern is appearing, who is responding to it and whether that behaviour is likely to persist.
In the age of algo trading, technical analysis works best when it stops being a collection of indicators and becomes a framework for reading market behaviour.