How the China+1 Strategy Could Benefit Pearl Global?
For decades, China has been a major manufacturing base for the global apparel industry.
However, geopolitical tensions, changing sourcing strategies and concerns about supply-chain concentration are encouraging international brands to diversify production across multiple countries. This shift, commonly called the China+1 strategy, creates an opportunity for apparel manufacturers that can offer reliable production across different geographies.
Pearl Global Industries is positioned to benefit from this shift through its manufacturing presence across India, Bangladesh, Vietnam, Indonesia and Guatemala. Instead of depending on a single country, the company can serve customers through multiple production locations, helping them diversify sourcing while maintaining supply continuity.
The opportunity is already visible in changing trade patterns. During its Q1 FY27 earnings call, management highlighted that China’s share of Japan’s clothing imports had declined from more than 65% to around 49-50%. Vietnam’s share had reached approximately 17.4%, while Bangladesh’s share stood at 4.3%.
For Pearl Global, the investment opportunity lies in converting this shift into additional customer orders, higher factory utilisation and sustainable earnings growth. However, the benefits will depend on where new orders are placed, how efficiently factories operate and whether additional volumes translate into better profitability.
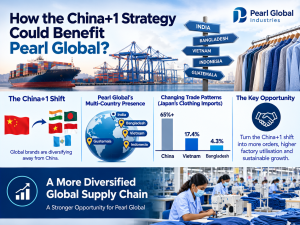
China+1 Creates an Opportunity, but How Much Revenue Can Pearl Global Capture?
The China+1 strategy is encouraging apparel brands to diversify manufacturing beyond China. Pearl Global could benefit through its presence in India, Bangladesh, Vietnam, Indonesia and Guatemala. However, the size of the industry's opportunity is not the same as the revenue the company can capture.
During Q1 FY27, Pearl Global reported consolidated revenue of ₹1,528 crore, up 24.5% year-on-year, and shipments of 20.8 million pieces. These figures establish that the business is growing, but management has not disclosed how much of this growth resulted specifically from China+1.
To evaluate the potential, three illustrative scenarios can be considered. The following are analyst estimates, not management guidance.
| Financial year | Conservative: incremental revenue | Base case: incremental revenue | Upside: incremental revenue |
| FY27 | ₹60 Cr | ₹120 Cr | ₹180 Cr |
| FY28 | ₹180 Cr | ₹300 Cr | ₹480 Cr |
| FY29 | ₹300 Cr | ₹600 Cr | ₹900 Cr |
These scenarios assume incremental China+1-related revenue of 1%, 2% and 3% of a ₹6,000 crore reference revenue base in FY27, increasing to 5%, 10% and 15% by FY29. The ₹6,000 crore base is a modelling assumption, not a disclosed FY27 result or a China+1 revenue target. The scenarios are not forecasts and do not establish the probability of capturing these orders.
The central question is whether Pearl Global can win additional business across India, Bangladesh and Vietnam without sacrificing margins. Until the company discloses order additions attributable to sourcing diversification, its actual share of the China+1 opportunity remains unquantified.
Can Higher Factory Utilisation Improve Revenue and EBITDA?
Pearl Global's ability to increase production from its existing facilities could be as important as adding new capacity. Management indicated that Indian factory utilisation was approximately 65-70%, leaving scope to increase output if orders and labour availability support it.
The company expected group capacity to reach 108 million pieces by September-October 2026 and 125-130 million pieces by FY28. During Q1 FY27, it shipped 20.8 million pieces, equivalent to an annualised rate of 83.2 million pieces. This annualisation is a simple run-rate calculation, not a full-year shipment forecast.
A sensitivity analysis illustrates the potential effect of higher utilisation. Using 128 million pieces as an illustrative FY28 capacity assumption and ₹735 per piece as the Q1 FY27 realisation, the results are:
| Capacity utilisation | Annual pieces | Illustrative revenue |
| 65% | 83.2 million | ₹6,115 Cr |
| 75% | 96.0 million | ₹7,056 Cr |
| 85% | 108.8 million | ₹7,997 Cr |
At a constant 10.7% adjusted EBITDA margin, the corresponding EBITDA would be approximately ₹654 crore, ₹755 crore and ₹856 crore, respectively. These are steady-state illustrations, not forecasts; they assume all capacity is usable, the product mix remains comparable and realisation and margins stay unchanged.
Higher utilisation can spread fixed costs across more units. However, wage increases, worker shortages, overtime, compliance expenses and inefficient ramp-ups can reduce the benefit. Additional output creates value only if the company can produce and deliver it at attractive margins. Check our latest video for more details.
Industry Sourcing Shifts Do Not Automatically Become Pearl Global Orders
The China+1 strategy is supported by changes in global apparel sourcing, but industry-level statistics should not be mistaken for company-specific gains.
Management highlighted that China's share of Japan's clothing imports had fallen from more than 65% to approximately 49-50%. Vietnam accounted for around 17.4%, while Bangladesh accounted for 4.3%. These figures indicate that apparel sourcing is distributed across multiple manufacturing countries. They do not measure Pearl Global's market share or the number of orders it has won from China.
The company's own operating data provides a more relevant starting point. Q1 FY27 consolidated shipments reached 20.8 million pieces, compared with 17.2 million pieces in the corresponding prior-year quarter. This represents shipment growth of approximately 20.9%. Revenue grew faster, at 24.5%, indicating that shipment volumes alone do not explain the entire increase.
Standalone revenue, which provides a view of the Indian business, rose 27.4% to ₹340 crore. However, the company has not provided a sufficiently detailed, comparable breakdown of incremental China+1 orders and revenue by India, Bangladesh and Vietnam to quantify the benefit attributable to each location.
The distinction matters because an increase in Bangladesh or Vietnam's share of global apparel sourcing may benefit many manufacturers, not just Pearl Global. The company's actual gains depend on customer allocations, order execution and competitive pricing.
Investors should look for disclosed country-level revenue, shipment volumes, customer additions and order growth. Until those figures are available, the company's share of the wider sourcing shift cannot be measured reliably.
Does the Planned Capital Expenditure Offer Attractive Returns?
Pearl Global planned capital expenditure of ₹200-250 crore for FY27. The investment needs to be assessed against the additional revenue and operating earnings it can generate, rather than against capacity additions alone.
A simple framework can illustrate the relationship between incremental revenue, EBITDA and planned capital expenditure. Assuming the entire ₹200-250 crore investment supports incremental business, and that incremental revenue earns the Q1 FY27 adjusted EBITDA margin of 10.7%, the scenarios are:
| Incremental annual revenue | EBITDA at 10.7% | Capex / incremental revenue | Capex / incremental EBITDA |
| ₹500 Cr | ₹53.5 Cr | 40-50% | 3.7-4.7x |
| ₹1,000 Cr | ₹107 Cr | 20-25% | 1.9-2.3x |
| ₹1,500 Cr | ₹160.5 Cr | 13.3-16.7% | 1.2-1.6x |
These are analyst illustrations, not management projections. The capital expenditure may support replacement, compliance, maintenance or other purposes as well as growth, so the entire amount cannot automatically be attributed to incremental revenue. The ratios also do not represent actual payback periods because they exclude taxes, working capital, maintenance expenditure and the timing of cash flows.
The framework nevertheless highlights the importance of scale. If new facilities generate substantial incremental revenue, the investment becomes easier to absorb. If customer orders arrive slowly or labour shortages restrict production, capacity can remain underutilised while capital is already committed.
For investors, the relevant test is whether incremental operating cash flow and returns on capital justify the investment, not simply whether the company meets its capacity targets.
Are Revenue Growth and Margin Expansion Sustainable?
Pearl Global's Q1 FY27 results showed an encouraging improvement in profitability. Consolidated revenue rose 24.5% year-on-year to ₹1,528 crore, while adjusted EBITDA excluding ESOP expenses increased 44.1% to ₹164 crore. The adjusted EBITDA margin reached 10.7%, up 140 basis points from the comparable prior-year quarter.
The margin improvement indicates that earnings grew faster than revenue. Higher shipment volumes, product realisation and operating efficiency can all contribute to this outcome. Q1 FY27 realisation was ₹735 per piece, compared with ₹715 in Q1 FY26 and ₹643 for FY26. Better realisation can support revenue and profitability, although its effect depends on product mix and manufacturing costs.
The standalone Indian business presents a useful counterpoint. Revenue increased 27.4% to ₹340 crore, but EBITDA was ₹22 crore and the margin declined to 6.6% from 7.3% a year earlier. This suggests that stronger revenue does not necessarily translate into margin expansion in every part of the group.
Management also highlighted wage increases in Haryana and Noida and challenges in worker availability. These factors can increase production costs or constrain output. New facilities may additionally incur start-up expenses before reaching efficient utilisation.
Consequently, the Q1 improvement should not be extrapolated mechanically into future years. Investors should monitor consolidated margins, realisation per piece, standalone profitability and cash conversion as capacity expands. Sustainable growth requires Pearl Global to maintain pricing and operating efficiency while absorbing higher wages, compliance costs and expansion-related expenses.
Conclusion
Pearl Global has several ingredients needed to benefit from China+1: a multi-country manufacturing network, growing shipments, improving consolidated profitability and planned capacity expansion. However, these advantages will create shareholder value only if global sourcing diversification translates into additional orders and efficient production.
The illustrative scenarios show that even a modest increase in incremental revenue could contribute to EBITDA, provided the company maintains its margins. They also demonstrate why the return on new capacity matters: capital expenditure can become a burden if facilities remain underutilised or higher wages erode profitability.
The next stage of analysis should focus on evidence rather than industry trends alone. Shipment growth, country-level business performance, capacity utilisation, margins and operating cash flow will help establish whether Pearl Global is capturing the opportunity.
Until management quantifies China+1-related orders or revenue, the strategy should be viewed as a potential growth driver rather than a separately measurable source of earnings. The investment case ultimately depends on execution, cost control and the returns generated from expansion.