Can the India-UK Trade Deal Boost Pearl Global’s Growth?
The India-UK trade deal could give Pearl Global Industries an opportunity to grow its UK business, but the investment case depends on three questions: how many additional orders can the company win, how much of that production can move to India, and how much of the benefit will reach its profits?
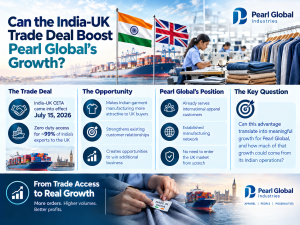
The India-UK Comprehensive Economic and Trade Agreement (CETA) came into effect on July 15, 2026. It provides preferential tariff treatment, including zero-duty access for nearly 99% of India's exports to the UK, subject to the agreement's applicable provisions and rules of origin. This can improve the competitiveness of eligible Indian garments in the British market.
For Pearl Global, the opportunity is not limited to finding new customers. The company already has international apparel relationships and a multi-country manufacturing network. If British buyers increase sourcing from India, Pearl Global could generate additional revenue while using more of its existing Indian manufacturing capacity.
However, management has not disclosed a company-specific revenue target for the trade deal, a quantified UK order pipeline or the proportion of additional UK business expected to be manufactured in India. The potential benefits therefore need to be assessed through scenarios rather than treated as confirmed growth.
How Much Additional Revenue Could Pearl Global Generate?
Pearl Global reported consolidated revenue of ₹1,528 crore in Q1 FY27, up 24.5% year-on-year. Adjusted EBITDA, excluding ESOP expenses, increased 44.1% to ₹164 crore, while profit after tax rose 51.4% to ₹99 crore.
The trade deal could provide another source of growth if British buyers increase their orders from Indian suppliers. During its Q1 FY27 earnings call, Pearl Global's management discussed the potential for Indian exports to the UK, expressing the view that exports of approximately US$1.2-1.3 billion could double over two to three years. This was management's assessment of the wider Indian export opportunity, not a Pearl Global revenue forecast.
Analyst estimate: Pearl Global's potential share
To understand the possible scale, assume that the wider Indian apparel export opportunity generates an additional US$1.2-1.3 billion in annual exports over the period. The following scenarios estimate what Pearl Global could capture if it secured 0.25%, 0.5% or 1% of that incremental market.
For conversion, the model assumes ₹85 per US dollar. The capture percentages and conversion rate are modelling assumptions, not management guidance.
| Scenario | Share of incremental exports | Potential annual revenue at full run-rate |
| Conservative | 0.25% | ₹26-28 crore |
| Moderate | 0.50% | ₹51-55 crore |
| Higher capture | 1.00% | ₹102-111 crore |
These figures represent potential annual revenue at full run-rate, not cumulative revenue over FY27-FY29. They also assume the wider export opportunity materialises and that Pearl Global wins the specified share of it. The model does not establish that the company has the customers, orders or capacity allocation required to achieve these outcomes.
For an illustrative ramp-up, the moderate scenario would translate into approximately ₹13-14 crore in FY27, ₹31-33 crore in FY28 and ₹51-55 crore in FY29, assuming the company reaches 25%, 60% and 100% of the potential run-rate in those years, respectively.
This is a scenario, not a forecast. The timing of customer decisions, order placement and production ramp-up could be materially different. Check our latest video for more details.
How Much of the New UK Business Could Move to India?
Additional UK orders for the group do not automatically mean additional production in India. Pearl Global operates across several countries, including Bangladesh, Vietnam, India, Indonesia and Guatemala. Customers may continue to source from these locations depending on cost, capacity, delivery requirements and the type of garment ordered.
Management has indicated that it expects a significant increase in UK business by the end of calendar 2026. However, the earnings-call information does not quantify the UK business as a share of consolidated revenue, disclose a specific order pipeline arising from the agreement, or specify how much incremental production will be allocated to Indian factories.
That makes the distinction between group growth and India-specific growth essential.
Consider the moderate analyst scenario above, which produces ₹51-55 crore of potential annual incremental UK revenue at full run-rate. The effect on Indian operations would vary according to how much of this business is manufactured in India.
| Assumed share produced in India | Potential annual Indian production revenue |
| 25% | ₹13-14 crore |
| 50% | ₹26-28 crore |
| 75% | ₹38-41 crore |
These are illustrative allocations, not disclosed company plans. The balance would be produced elsewhere in the group's network or would not qualify for Indian preferential treatment, depending on the actual sourcing arrangement and product origin.
This is why investors should not use a rise in consolidated UK sales alone as proof that the agreement is improving Indian factory economics. Evidence of higher India-based order volumes and production allocation would make the link much stronger.
Could Higher Indian Utilisation Improve EBITDA?
One potential benefit of additional UK orders is better utilisation of Pearl Global's Indian manufacturing facilities.
During the Q1 FY27 earnings call, management indicated that Indian factory utilisation was around 65-70%, compared with approximately 75-80% overseas. India's utilisation gap suggests that additional orders could allow the company to produce more garments without expanding capacity immediately.
Pearl Global's India operations reported revenue of ₹340 crore in Q1 FY27 and an adjusted EBITDA margin of 6.6%. The margin was affected in part by wage revisions in Haryana and Noida.
Analyst estimate: Revenue and EBITDA from higher utilisation
The following model assumes that the existing Indian revenue base rises in direct proportion to utilisation, with capacity, pricing and product mix unchanged. It uses the reported quarterly revenue of ₹340 crore and the disclosed 65-70% utilisation range as its starting point.
| Indian factory utilisation | Incremental quarterly revenue | EBITDA contribution at an assumed 8-12% incremental margin |
| 75% | ₹24-52 crore | ₹2-6 crore |
| 80% | ₹49-79 crore | ₹4-9 crore |
The figures are rounded. The incremental EBITDA margin of 8-12% is an analyst assumption, not a company-disclosed margin or forecast. The model measures the potential contribution from additional output; it does not predict the reported EBITDA margin of the Indian business.
The calculation is mechanical. For example, moving from 70% to 75% utilisation implies roughly 7% more output if capacity and product mix remain unchanged. Moving from 70% to 80% implies roughly 14% more output. Starting from 65% utilisation produces a larger relative increase.
Actual results could differ because revenue per garment varies by product, higher output may require additional workers and overtime, and factories may face bottlenecks in particular processes. The benefit will depend on labour availability, production efficiency, customer pricing and the costs required to fulfil additional orders.
The model also does not assume that the entire increase in output would come from UK customers. It illustrates the earnings potential of better utilisation, regardless of which customer or market generates the orders.
Will the Tariff Savings Improve Pearl Global's Margins?
Lower tariffs can improve the economics of sourcing from India, but the manufacturer may not capture the entire saving. A UK buyer could retain most of the benefit through a lower landed cost, or the buyer and supplier could share the savings through price negotiations.
The impact depends on the tariff that would otherwise have applied to the specific garment. Tariff rates vary by product classification and the applicable trade arrangement, so a single rate should not be assumed for Pearl Global's entire UK business.
Analyst estimate: How the benefit could be shared
To illustrate the economics, assume an eligible garment shipment with a pre-deal value of £100 would previously have attracted £10 in import duty. This is a hypothetical example, not a claim about the actual tariff on Pearl Global's products.
| Share of the assumed £10 saving captured by Pearl Global | Potential price increase retained by Pearl Global per £100 of eligible sales | Saving retained by the buyer |
| 25% | £2.50 | £7.50 |
| 50% | £5.00 | £5.00 |
| 75% | £7.50 | £2.50 |
If production costs remain unchanged, the additional price retained by Pearl Global could contribute to EBITDA. For every £100 of eligible pre-deal sales, the illustrative contribution would be £2.50, £5 or £7.50, depending on the negotiated split.
However, this should not be interpreted as a forecast of a 2.5-7.5 percentage-point increase in the company's reported EBITDA margin. The example concerns a hypothetical price uplift on eligible shipments; actual profitability will depend on product costs, price negotiations, customer demand and the mix of qualifying exports.
There is another possible outcome: Pearl Global may retain little of the tariff saving but win more orders because its customers can buy at a lower landed cost. In that case, the benefit would come mainly through volume and factory utilisation rather than higher margins on each garment.
The strongest outcome would combine both effects: enough tariff savings passed through to customers to stimulate orders, while Pearl Global retains sufficient pricing and operating leverage to earn an adequate return. If buyers capture nearly all the savings and the company must reduce its own prices to remain competitive, revenue could increase without a meaningful improvement in profitability.
What Could Stop the Opportunity From Materialising?
The agreement improves market access, but it does not guarantee that British retailers will increase their purchases from Pearl Global.
First, the company must satisfy customer requirements on quality, compliance, price and delivery. Retailers increasingly want suppliers that can respond quickly to changes in demand, making production flexibility and reliable execution important.
Second, preferential tariff access depends on the applicable rules of origin. A garment does not qualify merely because it is exported by an Indian company; its production and origin must meet the agreement's requirements.
Third, Indian manufacturing faces operating challenges. Pearl Global's India business reported a 6.6% adjusted EBITDA margin in Q1 FY27, with wage revisions among the pressures discussed by management. Additional orders will only create value if production costs and efficiency remain under control.
Finally, competing Indian exporters may also benefit from the agreement. If several suppliers offer lower landed costs, UK buyers may negotiate harder on garment prices, limiting the amount of tariff savings that manufacturers retain.
For these reasons, the trade deal should be treated as a potential growth catalyst, not as a guaranteed earnings upgrade.
FY27-FY28: A Timeline for Testing the Investment Case
The agreement entered into force in July 2026, so investors can begin evaluating its impact through subsequent operating disclosures. The assessment should focus on measurable outcomes rather than management commentary alone.
- FY27: Evidence of order conversion
The first milestone is whether the expected increase in UK business begins to appear in customer orders and shipments. Investors should look for repeat orders, not just enquiries or initial production runs. They should also seek clarity on whether the incremental business is being manufactured in India or elsewhere in the group.
- FY28: Evidence of operating leverage
The next milestone is whether Indian factory utilisation moves towards 75% and, potentially, 80%, without requiring disproportionate increases in costs. India's adjusted EBITDA margin should be monitored alongside utilisation. A sustained improvement would indicate that higher volumes are translating into better operating performance.
- FY28 onward: Evidence of durable growth
The longer-term test is whether higher UK orders persist and contribute to repeat business. Investors should assess revenue growth, the share of production allocated to India, operating margins and the consistency of customer orders. The company should ideally disclose enough information to separate trade-deal-related growth from broader demand, product mix and changes in other markets.
These milestones are assessment benchmarks, not management targets. The company has not committed to 75-80% Indian utilisation or disclosed a specific timetable for reaching those levels through the trade deal.
Conclusion
The India-UK trade deal could help Pearl Global secure additional apparel orders, improve utilisation at Indian factories and generate operating leverage. An illustrative model suggests that capturing 0.5% of a potential US$1.2-1.3 billion increase in Indian exports to the UK could translate into ₹51-55 crore of annual incremental revenue at full run-rate. That is a scenario based on management's broader industry assessment, not a company-specific forecast.
The direct benefit to Indian operations remains unquantified because Pearl Global has not disclosed a UK revenue share, a deal-specific order pipeline or a confirmed production allocation. Higher utilisation could also add to EBITDA, but only if labour availability, pricing and production costs support profitable growth.
For investors, the decisive evidence will be a combination of rising UK orders, a greater share of production in India and sustained improvement in Indian operating margins. Until these indicators appear in reported results, the trade deal is a credible opportunity but not yet a quantified earnings driver.