Can Data Patterns Really Grow 20-25% Every Year?
Data Patterns has committed to maintaining 20-25% revenue growth, alongside an EBITDA margin of around 35-40%. The target looks reasonable when compared with its history: revenue increased from ₹224 crore in FY21 to ₹925 crore in FY26, a roughly 33% CAGR.
But that history alone does not prove that the company can compound at 20-25% from here.
The harder question is whether Data Patterns can keep replacing the revenue it delivers every year with enough new orders while moving development programmes into production and maintaining margins.
The answer is potentially yes, but only if several things happen together. The current order book provides a strong starting point, but a significant portion is still negotiated rather than contracted. Meanwhile, the next leg of growth depends increasingly on development-to-production conversion, electronic warfare and seeker programmes.
So the right way to test the 20-25% target is to build the numbers forward.
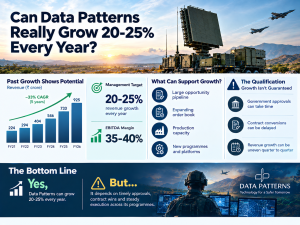
First, What Does 20-25% Growth Actually Require?
Starting with FY26 revenue of ₹925 crore, 20-25% growth would require FY27 revenue of approximately ₹1,110-1,156 crore.
If Data Patterns then maintains the same growth rate, the required revenue rises quickly:
| ₹ crore | 20% growth | 22.5% growth | 25% growth |
| FY26 | 925 | 925 | 925 |
| FY27 | 1,110 | 1,133 | 1,156 |
| FY28 | 1,332 | 1,388 | 1,445 |
| FY29 | 1,598 | 1,700 | 1,807 |
| FY30 | 1,918 | 2,083 | 2,258 |
These are calculations, not management guidance.
The important point is the annual incremental requirement.
At the midpoint 22.5% scenario, Data Patterns has to add roughly ₹208 crore of revenue in FY27, ₹255 crore in FY28, ₹312 crore in FY29 and ₹383 crore in FY30.
That is the real test.
The company cannot simply grow because FY26 order inflows were strong. It has to continuously create another ₹200-380 crore of revenue every year as its base gets larger.
Where Can The Incremental Revenue Come From?
The PDF does not disclose enough information to honestly allocate future revenue between radar, avionics, EW, seekers and services. So an exact company revenue bridge cannot be constructed without inventing numbers.
But the sequence of growth can be mapped.
FY27: Existing Production Does Most Of The Work
The first leg should primarily come from existing radar, avionics, missile-related and other production programmes.
The company entered FY27 with a ₹2,654 crore headline order book, including approximately ₹920 crore of signed orders and ₹1,726 crore of negotiated orders. FY26 also saw ₹1,121 crore of fresh order inflows.
The PDF identifies specific orders supporting near-term execution: the ₹288 crore IMD Doppler weather-radar order, the ₹585.76 crore BEL radar-electronics order, BrahMos-related work and other repeat programmes.
This means FY27 does not require the EW opportunity to suddenly become a major revenue contributor.
The first ₹200-230 crore of incremental revenue can plausibly come from converting the existing production backlog while development programmes continue moving forward.
That makes FY27 the least demanding year in the 20-25% thesis.
FY28: Development-To-Production Becomes More Important
The harder step comes after the existing backlog starts getting consumed.
Data Patterns' FY26 revenue mix was approximately 51% production, 40% development and 9% services. The encouraging part is that development's share has fallen from around 66% in FY23 to 40% in FY26, while production increased from 29% to 51%.
That is evidence that the business has historically shifted toward production as programmes mature.
The PDF also gives a useful timing framework: development-to-production conversion generally takes 12-36 months, while large radar programmes can run for 2-3 years.
So the FY28 growth requirement increasingly depends on today's development pipeline becoming tomorrow's production revenue.
This is where avionics, radar programmes, BrahMos-related production and newer electronic-warfare products matter.
FY29-FY30: New Programmes Must Replace The Backlog Being Consumed
By FY29 and FY30, simply executing today's order book is not enough.
At a 22.5% growth rate, revenue reaches roughly ₹1,700 crore in FY29 and ₹2,083 crore in FY30.
That requires Data Patterns to add another ₹695 crore of annual revenue over FY28-FY30.
This is where the next generation of products becomes important: EW systems, seeker production, counter-drone systems, space applications, avionics programmes and eventually exports.
The PDF identifies EW as a potential ₹10,000 crore market and the jammer opportunity at roughly ₹7,400 crore. But those numbers should not be confused with Data Patterns' future revenue.
The investment case only improves materially when these opportunities cross the sequence:
development → qualification → production order → volume production.
That is the bridge that has to carry Data Patterns from a ₹925 crore business toward ₹2,000 crore-plus. Check our latest video for more details.
The ₹1,726 Crore Negotiated Order Book Is Not Worth ₹1,726 Crore Yet
This is arguably the biggest weakness in the headline order-book number.
The ₹2,654 crore figure consists of approximately:
- ₹920 crore signed orders
- ₹1,726 crore negotiated but not yet contracted
That means roughly 65% of the headline order book is still dependent on conversion into contracts.
A simple risk-adjustment makes the distinction clearer.
The PDF does not provide a probability of conversion, so the following is an analytical sensitivity, not a company disclosure:
| Conversion assumption on ₹1,726 Cr negotiated orders | Risk-adjusted order book |
| 40% | ₹1,610 Cr |
| 50% | ₹1,783 Cr |
| 70% | ₹2,128 Cr |
| 100% | ₹2,646 Cr* |
*₹2,646 crore reflects the PDF's ₹920 crore signed plus ₹1,726 crore negotiated figures; the small difference from ₹2,654 crore reflects rounding in the source data.
Using a neutral 50% scenario, the risk-adjusted book is about ₹1,783 crore, not ₹2,654 crore.
Against FY27 revenue of roughly ₹1,133 crore under the midpoint growth case, that represents around 1.6× revenue coverage.
The signed portion alone covers only about 0.8× FY27 revenue.
That changes the interpretation significantly.
Data Patterns has enough visibility to support growth, but the headline order book should not be treated as fully bankable revenue.
Can Development Really Become Production?
There is evidence that it can but it is not instantaneous.
The strongest evidence in the PDF is the change in revenue mix.
Development accounted for roughly 66% of revenue in FY23, compared with around 40% in FY26. Production moved in the opposite direction, from about 29% to 51%.
That is exactly what an investor would want to see from a development-led defence-electronics company.
There are also concrete programme examples.
The Arudhra long-range radar generated more than ₹180 crore of Data Patterns revenue and was executed over roughly three years as part of the larger BEL programme. Precision Approach Radar programmes have already moved through delivery. The company is also executing the ₹288 crore IMD Doppler weather-radar order over approximately 18 months.
The broader pattern is therefore credible:
Development contracts today can create production orders later.
But investors should not assume that every development programme follows this path.
The reports say development orders can take 12-36 months to mature, and certification or customer acceptance can stretch timelines. The jammer pod, for example, remains dependent on successful qualification before commercial scale-up.
That means the 40% development share is an opportunity but also a conversion risk.
The Margin Question: Growth Does Not Automatically Mean Profit Grows At The Same Rate
Data Patterns' 20-25% revenue target is paired with a 35-40% EBITDA-margin objective.
But Q1 FY27 showed why investors should not simply apply 40% to every future revenue number. EBITDA margin was around 27%, affected by uneven revenue recognition, higher employee costs and the mix of strategic orders.
The following scenarios show what the 22.5% revenue-growth path would mean:
| FY | Revenue at 22.5% growth | EBITDA @35% | EBITDA @37.5% | EBITDA @40% |
| FY26 | ₹925 Cr | ₹324 Cr | ₹347 Cr | ₹370 Cr |
| FY27 | ₹1,133 Cr | ₹397 Cr | ₹425 Cr | ₹453 Cr |
| FY28 | ₹1,388 Cr | ₹486 Cr | ₹521 Cr | ₹555 Cr |
| FY29 | ₹1,700 Cr | ₹595 Cr | ₹638 Cr | ₹680 Cr |
| FY30 | ₹2,083 Cr | ₹729 Cr | ₹781 Cr | ₹833 Cr |
Again, these are scenario calculations, not forecasts.
The important investor takeaway is the spread.
By FY30, a 35% margin would produce roughly ₹729 crore of EBITDA, while a 40% margin would produce about ₹833 crore.
That is a ₹104 crore difference on the same revenue base.
So the quality of growth matters almost as much as the growth rate.
If Data Patterns grows by taking lower-margin strategic orders, carrying excess engineering capacity or absorbing higher development costs, revenue could rise 20-25% without EBITDA keeping pace.
Conversely, if development programmes move into repeat production, fixed costs are absorbed over larger volumes and the product mix becomes more IP-led, the company has a path back toward the upper end of its margin range.
The Real Test Starts After FY27
The ₹2,000 crore FY27 order-inflow target is useful, but it should not be confused with four years of growth visibility.
At the midpoint 22.5% revenue scenario, FY27 revenue would be around ₹1,133 crore.
Management's longer-term ambition is to build an order book equivalent to roughly three years of projected revenue. At that FY27 revenue level, that would imply a roughly ₹3,400 crore order book.
Against the current ₹2,654 crore headline figure, another roughly ₹750 crore would be required simply to reach that three-year coverage level before considering execution and order-book consumption.
The risk-adjusted picture is tougher.
At a 50% conversion assumption, the current book is only around ₹1,783 crore. Reaching approximately ₹3,400 crore would therefore require more than ₹1,600 crore of additional orders.
This is why replenishment matters.
If Data Patterns wants to sustain 20-25% growth, it cannot merely execute the existing backlog. It needs a recurring annual order-inflow engine that is at least large enough to replace revenue being delivered and large enough to build additional coverage.
The company's ₹2,000-4,000 crore pipeline over the next 24 months is therefore strategically important.
At the low end, ₹2,000 crore is still meaningful relative to a ₹1,100-1,400 crore annual revenue base. At the high end, ₹4,000 crore could create substantial coverage.
But the pipeline is not the same as orders.
And orders are not the same as revenue.
That distinction is central to the entire investment case.
So, Can Data Patterns Really Grow 20-25% Every Year?
It can, but the evidence supports a conditional answer not a guaranteed one.
The near-term case is strong. FY26 revenue reached ₹925 crore, order inflows jumped to ₹1,121 crore, and the headline order book expanded to ₹2,654 crore.
The medium-term case depends on development programmes converting into production. The historical shift from 66% development / 29% production in FY23 to 40% development / 51% production in FY26 provides evidence that this conversion mechanism works.
The long-term case requires something more difficult: new EW, seeker, counter-drone, space and avionics programmes must begin replacing the revenue generated by today's backlog.
The biggest warning sign is the ₹1,726 crore negotiated component. Under a 50% analytical conversion assumption, the risk-adjusted order book falls from ₹2,654 crore to roughly ₹1,783 crore.
That is still substantial but much less comfortable.
The investor should therefore track five numbers rather than simply watching revenue growth:
- Signed orders versus negotiated orders
- Annual order inflows versus revenue growth
- Development revenue converting into production
- EBITDA margin moving back toward 35-40%
- Order-book coverage relative to the next 12 months of revenue
If Data Patterns can keep replenishing its backlog while moving development products into serial production, 20-25% growth is achievable.
But if order conversion continues to slip, development programmes remain stuck in qualification, or margins fall because growth comes from lower-return contracts, the headline 20-25% target could prove much harder to sustain.
The real Data Patterns thesis is therefore not “20-25% growth every year.” It is whether the company can build a self-replenishing order-to-production-to-repeat-order cycle.