How Does HBL Engineering Make Money?
HBL Engineering is no longer a simple battery manufacturer. In FY26, its consolidated revenue reached ₹3,302.83 crore, EBITDA was ₹1,130 crore and net profit was ₹797 crore. But the more important change is where those earnings came from: Electronics became almost as large as Batteries in revenue, while its disclosed segment operating economics were substantially stronger.
The difficulty for investors is that HBL does not disclose revenue and profit for every product separately. It reports Batteries and Electronics as its two reportable operating segments, while Defence & Aviation is disclosed within the broader segment information in the annual report. Therefore, the right way to understand HBL is to combine the audited segment accounts with the company's disclosures on individual businesses such as Kavach, Ni-Cd, PLT, defence batteries and electric drivetrains.
That reveals a business with one very large current earnings engine, Kavach-led Electronics, supported by established battery businesses and a pipeline of products still moving through qualification and commercialisation.
HBL's Revenue Is Concentrated in Two Reportable Segments
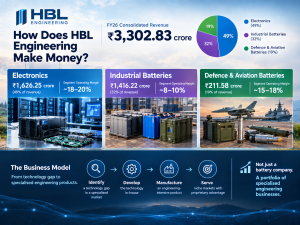
HBL's FY26 consolidated segment disclosure reports ₹1,416.22 crore of Batteries revenue, ₹211.58 crore of Defence & Aviation revenue and ₹1,626.25 crore of Electronics revenue. After ₹8.49 crore of inter-segment revenue, consolidated revenue was ₹3,302.83 crore.
| FY26 segment | Segment revenue | Share of consolidated net revenue* | Segment operating income** | Operating margin |
| Batteries | ₹1,416.22 Cr | 42.9% | ₹348.78 Cr | 24.6% |
| Defence & Aviation | ₹211.58 Cr | 6.4% | ₹73.24 Cr | 34.6% |
| Electronics | ₹1,626.25 Cr | 49.2% | ₹844.99 Cr | 52.0% |
| Unallocated | ₹57.27 Cr | 1.7% | ₹(127.77) Cr | - |
| Total | ₹3,311.32 Cr | 100% | ₹1,139.24 Cr | - |
Note: Segment operating income is calculated from HBL's audited disclosure as revenue less identifiable and allocated operating expenses. It is not EBITDA. HBL then reports ₹76.88 crore of unallocable expenses, taking operating profit to ₹1,062.36 crore.
This table immediately changes the way HBL should be viewed.
Electronics generated ₹1,626.25 crore, or 49.24% of consolidated revenue, and ₹844.99 crore of segment operating income. Batteries generated ₹1,416.22 crore and ₹348.78 crore of segment operating income. Defence & Aviation was much smaller at ₹211.58 crore but generated ₹73.24 crore of segment operating income.
The numbers also explain why simply calling HBL a battery company is increasingly misleading.
But HBL Does Not Disclose Revenue for Each Battery or Electronics Product
This is important because the company's product portfolio is much more granular than its financial reporting.
Within Batteries, HBL operates Lead Batteries, Nickel-Cadmium Batteries and Lithium Batteries. Within Industrial Electronics, it has Kavach/TMS/CTC, electric drivetrains and other industrial electronics. Defence has defence batteries, electronic fuzes and special defence products. HBL itself describes these as nine business units.
However, the FY26 annual report does not provide audited rupee revenue or profit separately for Ni-Cd, PLT, defence batteries, Kavach, TMS/CTC or electric drivetrains.
That means the article should not assign artificial revenue numbers to these businesses.
What can be quantified is the financial segment they sit inside, the specific growth disclosed by management and the stage each business has reached.
| Major business | FY26 revenue separately disclosed? | What HBL discloses about FY26 | Current commercial status |
| Kavach | No | Contributed almost 50% of sales in FY26 | Major current revenue driver |
| Industrial Ni-Cd | No | Double-digit growth in FY26 | Established business; healthy FY27 order book |
| PLT batteries | No | Data-centre business sales grew 100% YoY | Established; capacity being doubled |
| Defence batteries | No | No separate FY26 revenue disclosed | Established replacement business |
| Defence electronic fuzes
| No | Sales of grenade fuzes have started | Other applications awaiting qualification |
| TMS/CTC
| No | Less than 2% of railway network covered by TMS | Early commercialisation |
| Electric drivetrains
| No | No material FY26 sales disclosed | Homologation targeted by March 2027; pilot sales from July 2027 |
| Defence Li-ion batteries | No | No separate FY26 revenue disclosed | ₹200 Cr R&D/production investment; commercial business being built |
The absence of product-level revenue is itself an important investor fact. HBL gives enough information to identify the earnings engines, but not enough to construct a precise product-level profit-and-loss account.
Batteries: A ₹1,416 Crore Business With Three Very Different Engines
The Batteries segment generated ₹1,416.22 crore of FY26 revenue and ₹348.78 crore of segment operating income, giving a calculated segment operating margin of 24.63%.
But the revenue pool is changing.
Lead batteries
HBL's conventional lead-battery business includes railway batteries, UPS batteries and telecom applications. Telecom is under structural pressure because service providers have migrated toward lithium-ion solutions. HBL explicitly says it does not supply lithium-ion telecom packs because the margins are too low to justify several years of warranty.
Railway demand remained stable in FY26, while HBL maintained its share in train lighting, AC coach and signalling applications. The company also remains positioned in UPS batteries, where it says it is the number-three player in India.
PLT: A smaller but strategically important battery business
HBL is the only manufacturer of Lead Pure Lead Thin batteries in India. The product is increasingly targeted at data centres, where HBL secured orders from STT, NTT, Colt, CapitaLand, Digital Edge, Reliance and CtrlS.
The company reported 100% growth in its data-centre business during FY26 and is doubling PLT production capacity. It also supplies PLT batteries to Cummins India for its diesel generator range.
But there is no separate PLT revenue figure in the annual report. Therefore, the correct conclusion is that PLT is growing rapidly from a disclosed but unquantified base, not that it generated a particular percentage of Batteries revenue.
Ni-Cd: The established high-value industrial battery franchise
Ni-Cd is much more important to HBL's future than its absence from the segment table might suggest.
HBL describes itself as the second-largest supplier of industrial Nickel-Cadmium batteries globally. The business serves oil refineries, power plants, oil and gas pipelines, metros, tunnels and railway applications. HBL recorded double-digit growth in FY26, while exports grew about 15%. The company ended FY26 with a healthy FY27 order book and said capacity expansion was required to meet demand.
Again, HBL does not disclose the exact rupee revenue of Ni-Cd.
That matters for the investment thesis because Ni-Cd is one of the four business units HBL itself expects to contribute most to sales growth over the next four years, alongside Kavach, electronic fuzes and electric drivetrains.
Defence: ₹211.58 Crore Today, With a Wider Product Pipeline
Defence & Aviation generated ₹211.58 crore in FY26 and ₹73.24 crore of segment operating income, a calculated margin of 34.62%.
The established business is defence batteries. HBL supplies batteries for aircraft, missiles, armoured vehicles, torpedoes and submarines. The company describes these as replacement items: individual battery orders can fluctuate, but aggregate demand tends to grow as the installed defence fleet expands.
HBL also supplies other defence electronics, including communication systems for armoured vehicles and platform-management and steering systems for Scorpene submarines.
The bigger future opportunity is electronic fuzes.
HBL has developed the required fuze technology in-house since 2006. Its grenade fuzes have received Ministry of Home Affairs approval and sales have started. Approvals for Indian Army use and 155mm artillery fuzes are expected during 2027, according to management.
But these businesses should not be added to FY26 revenue without disclosure. They are potential contributors to future earnings, not proven FY26 revenue pools.
Electronics: The ₹1,626 Crore Earnings Engine
Electronics is where HBL's financial profile changed most dramatically.
The segment generated ₹1,626.25 crore in FY26 versus ₹298.38 crore in FY25. Its calculated segment operating income was ₹844.99 crore, compared with the much smaller ₹348.78 crore generated by Batteries.
This produces a calculated segment operating margin of 51.96%.
But this number needs a major qualification.
51.96% is not HBL's EBITDA margin.
It is segment operating income divided by segment revenue. HBL's consolidated FY26 EBITDA was ₹1,130 crore, while consolidated net profit was ₹797 crore in the key-information presentation. The audited consolidated segment note reports ₹1,062.36 crore of operating profit after ₹76.88 crore of unallocable expenses, followed by other income, exceptional items, interest, associate/JV income and tax before arriving at ₹814.90 crore of consolidated net profit.
The ₹797 crore and ₹814.90 crore figures differ because the former is the company's rounded key-information figure while the latter is the audited consolidated statement figure; the audited financial statements should be used for detailed reconciliation.
| FY26 profit bridge | ₹ crore |
| Electronics segment operating income Less: total unallocable expenses | ₹844.99 Cr ₹76.88 Cr |
| Illustrative remainder if all unallocable expenses were charged to Electronics | ₹768.11 Cr |
| Consolidated operating profit | ₹1,062.36 Cr |
| Other income | ₹58.99 Cr |
| Exceptional items | ₹(31.25) Cr |
| Interest expense | ₹14.69 Cr |
| Share of associate/JV profit | ₹16.34 Cr |
| Profit before tax | ₹1,092.21 Cr |
| Tax | ₹277.31 Cr |
| Audited consolidated net profit | ₹814.90 Cr |
Critical note: ₹768.11 crore is only a mechanical sensitivity, not Electronics' actual post-corporate profit. HBL does not disclose how the ₹76.88 crore unallocable expense, other income, exceptional items, interest, associate/JV income and tax should be allocated among individual segments. Therefore, it is not possible to state that Electronics “generated” a specific amount of consolidated PAT.
This distinction is crucial. Electronics clearly drove the segment-level operating improvement, but the audited accounts do not permit a precise after-tax profit attribution to Electronics.
Kavach Is the Key to Understanding Electronics
HBL Engineering’s Electronics segment generated ₹1,626.25 crore of revenue in FY26, making it the company’s largest segment by revenue. But to understand what is driving that number, Kavach is the starting point. Management said Kavach contributed almost 50% of HBL’s sales in FY26, and expects a similar contribution in FY27.
This makes Kavach much more than another product within Electronics. It is the segment’s largest current earnings driver, while other businesses such as Train Management Systems (TMS), Centralised Traffic Control (CTC), electric drivetrains and industrial electronics are at different stages of commercialisation.
However, Kavach’s revenue contribution should not be treated as a fixed recurring stream. HBL has explained that contract structures can create significant differences in quarterly revenue recognition and margins. Competitive bidding can also affect margins, while delays in wayside execution can push revenue into later periods. This means a strong order book does not automatically translate into an identical quarterly revenue or profit trajectory.
There is another issue investors need to watch. HBL expects Kavach competition to increase from FY29, with management indicating that sales and PBT could decline thereafter. That creates a clear requirement for the newer Electronics businesses to scale before Kavach enters a more competitive phase.
HBL does not separately disclose Kavach revenue, Kavach-specific operating profit or its exact contribution to the Electronics order book. Therefore, the “almost 50% of sales” figure is the cleanest disclosed measure of its current importance. The more important question for investors is whether TMS/CTC, electric drivetrains and other electronics businesses can build enough revenue and profit to reduce this concentration over time. Check our latest video for more details.
What About the Other Electronics Businesses?
Kavach is not the only business inside Electronics.
HBL’s TMS/CTC business has a much longer runway in terms of network penetration. The company says less than 2% of the Indian railway network is covered by TMS, while its software has already been successfully deployed in four installations.
But this remains an emerging revenue stream rather than an FY26 earnings replacement for Kavach.
Electric drivetrains are even earlier.
HBL has spent years developing a complete electric drivetrain comprising batteries, motors and electronics for 55-tonne trucks. The company has completed around 40,000 km of internal road trials, with homologation expected by March 2027 and pilot sales targeted from July 2027.
Therefore, it would be misleading to treat TMS/CTC and electric drivetrains as current substitutes for Kavach. They are potential future revenue engines.
Capital Invested → Revenue → Return: Where Is HBL’s Money Already Working?
HBL Engineering’s growth story is not only about how much revenue each business generates, but also about how much capital is required to build those businesses. This matters because a high-margin business can still create weak shareholder returns if it requires excessive capital to scale.
The clearest disclosed example is HBL’s lithium-ion battery programme for defence applications. The company has committed around ₹200 crore toward R&D and a modern production plant for this business. Unlike established battery operations, this investment is being made ahead of the full commercial ramp-up. The eventual return on this capital will depend on the pace at which HBL converts its defence qualifications and orders into recurring production.
HBL has also invested heavily in developing newer technology businesses, including electric drivetrains, electronic fuzes, TMS/CTC and other railway electronics. However, the company does not separately disclose the capital invested in each of these businesses.
It would therefore be misleading to calculate product-level returns by assigning an arbitrary investment figure to them.
At the company level, the balance sheet provides a clearer picture of the returns being generated from HBL’s broader capital base. FY26 ended with ₹2,172 crore of net worth, compared with ₹1,458 crore a year earlier, while debt-to-equity remained very low at 0.03. More importantly, HBL generated ₹713 crore of net cash from operations in FY26, compared with ₹227 crore in FY25.
This is important because HBL is funding new growth while still converting a substantial portion of accounting profit into operating cash. The next stage of the investment story, therefore, is not simply whether HBL can grow revenue, but whether its newer businesses can generate returns comparable with its established high-margin operations without materially increasing the capital intensity of the company.
What Happens If Kavach Slows?
This is the most important earnings-sensitivity question in the entire business.
HBL itself says Kavach contributed almost 50% of sales in FY26 and expects its contribution to remain about the same in FY27. It also says competition could increase from FY29, with both sales and PBT potentially declining thereafter.
The problem is that HBL does not disclose the exact rupee Kavach revenue or its standalone margin. Therefore, a precise ₹500 crore or ₹1,000 crore “Kavach decline” calculation would be false precision.
Instead, the sensitivity should be expressed relative to the undisclosed Kavach revenue:
| Kavach scenario | Direct revenue impact | What would need to replace it |
| Kavach revenue falls 10% | 10% of FY26 Kavach revenue | Additional revenue from Ni-Cd, TMS/CTC, defence, PLT or e-drives |
| Kavach revenue falls 20% | 20% of FY26 Kavach revenue | Same amount of replacement revenue |
| Kavach revenue falls 30% | 30% of FY26 Kavach revenue | Same amount of replacement revenue |
The exact rupee impact cannot be calculated from HBL’s audited disclosures because Kavach revenue is not separately reported.
This is not a weakness in the analysis; it is an important limitation in the available data.
What can be established is that HBL has identified Ni-Cd, electronic fuzes and electric drivetrains alongside Kavach as the four business units expected to contribute most to sales growth over the next four years. HBL also expects industrial electronics and special defence products currently under development to be commercialised by FY30.
The replacement problem, therefore, is not simply “Can another battery business replace Kavach?”
It is whether several smaller businesses can scale simultaneously enough to absorb a future decline in the largest current Electronics contributor.
The Real Earnings Bridge Is From Kavach to a Portfolio
HBL’s FY26 numbers show why the transition matters.
The company generated ₹3,302.83 crore of consolidated revenue and ₹814.90 crore of audited consolidated net profit. Electronics produced ₹844.99 crore of segment operating income, compared with ₹348.78 crore from Batteries and ₹73.24 crore from Defence & Aviation.
At the same time, HBL’s own FY30 scenario identifies four businesses expected to contribute most to sales over the next four years:
- Kavach
- Industrial Ni-Cd batteries
- Electronic fuzes
- Electric drivetrains for trucks
HBL says the current businesses together could exceed ₹5,000 crore of sales by FY30, but explicitly labels this a scenario rather than a prediction.
That distinction matters.
Kavach is already a large commercial business. Ni-Cd is already established and growing. Fuzes have begun selling in one application but still require further approvals. Electric drivetrains have not yet reached pilot sales.
These businesses therefore cannot currently be treated as four equivalent revenue engines.
The Investor Takeaway
HBL makes money from a portfolio, but the portfolio is not yet financially balanced.
The FY26 accounts show a clear hierarchy. Batteries generated ₹1,416.22 crore of revenue and ₹348.78 crore of segment operating income. Electronics generated ₹1,626.25 crore and ₹844.99 crore of segment operating income. Defence & Aviation generated ₹211.58 crore and ₹73.24 crore respectively.
Within that Electronics number, Kavach is the critical driver, with management saying it contributed almost 50% of sales in FY26. Yet HBL does not separately disclose Kavach revenue, standalone margin or its exact order-book contribution.
That creates the central investor question.
HBL does not need another business merely to grow. It needs its newer businesses to become financially meaningful before Kavach’s economics become less favourable.
Ni-Cd is already established. PLT is scaling. Defence batteries provide a recurring specialised base. Electronic fuzes are moving through qualification and have started generating sales in grenades. TMS/CTC remains early. Electric drivetrains are still waiting for homologation and pilot sales.
The company’s FY26 performance therefore tells two stories at once.
The first is that HBL has created an unusually profitable Electronics business. The second is that a large part of that step-up is tied to Kavach, whose contract structure can produce substantial variation in revenue and margins and whose own management expects greater competition from FY29 onward
For investors, the key metric going forward is therefore not simply HBL’s order book or revenue growth.
It is whether Ni-Cd, defence products, TMS/CTC, PLT and electric drivetrains can collectively become large enough to reduce the earnings sensitivity to Kavach.
That is the real answer to how HBL Engineering makes money today and what will determine whether its current earnings structure remains durable.