Why Did Data Patterns’ Other Income Drop by ₹20 Crore in FY26
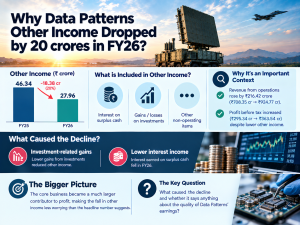
Data Patterns’ other income fell sharply in FY26 even as the core business delivered strong growth. Other income declined from ₹46.34 crore in FY25 to ₹27.96 crore in FY26, a fall of ₹18.38 crore or 39.68%.
But the important question is not whether other income fell. It is what disappeared from FY25’s ₹46.34 crore and whether that income can be expected again.
The answer is revealing.
FY25 contained ₹15.43 crore of fair-value gains on investments and ₹9 crore of profit from selling investments. Neither is a dependable annual earnings stream. Interest income of ₹19.94 crore was more repeatable, but even that fell to ₹9.73 crore in FY26.
Meanwhile, revenue from operations increased from ₹708.35 crore to ₹924.77 crore, while profit before tax rose from ₹295.34 crore to ₹363.54 crore.
So the real story is not that ₹18.38 crore of operating profit vanished. It is that a volatile investment-income component became smaller while the operating business became a larger part of reported profit.
FY25’s ₹46.34 Crore Was Never Fully Recurring
The first step is to separate FY25 other income into different types.
- Interest income: ₹19.94 crore
- Profit on sale of investments: ₹9.00 crore
- Fair-value gain on investments: ₹15.43 crore
- Foreign-exchange gain: ₹1.19 crore
- Other non-operating income: ₹0.14 crore
- Provision written back: ₹0.64 crore
That ₹46.34 crore therefore cannot be treated as a normal annual run-rate.
Interest income is the most recurring component because it comes from bank deposits. But even that is not fixed.
The ₹15.43 crore fair-value gain was an accounting gain from revaluing investments, while the ₹9 crore profit on sale was generated by actually selling investments. Both depend on the company's investment portfolio and market conditions.
The ₹0.64 crore provision write-back was also not a normal operating income stream.
This leaves a much smaller pool of income that can reasonably be treated as recurring.
In FY26, interest income fell to ₹9.73 crore, while realised investment gains increased to ₹22.21 crore and fair-value gains turned into a ₹7 crore loss.
The headline ₹18.38 crore decline therefore largely reflects the removal of volatile investment gains rather than deterioration in the defence business.
The ₹22.43 Crore Swing Was a Mutual-Fund Mark-to-Market Loss
The single biggest reason for the decline was the change in fair-value accounting.
Data Patterns recorded a ₹15.43 crore fair-value gain in FY25, but a ₹7.00 crore fair-value loss in FY26.
That creates a negative swing of ₹22.43 crore.
The annual report identifies the underlying investment category: mutual funds measured at fair value through profit or loss (FVTPL). Their carrying value was ₹326.55 crore at March 31, 2025 and ₹328.85 crore at March 31, 2026. The portfolio consisted of quoted mutual funds, including arbitrage, money-market and short-term debt funds.
Importantly, the annual report does not attribute the ₹7 crore loss to any one named fund. Therefore, assigning the loss to a specific security would go beyond the disclosed data.
The accounting treatment does tell investors something important.
The ₹7 crore loss was a fair-value remeasurement, not a ₹7 crore operating cash outflow. The cash-flow statement adds the ₹7 crore fair-value loss back while calculating operating cash flow.
So this was essentially a mark-to-market movement in the mutual-fund portfolio.
That makes it volatile and unsuitable as a recurring profit assumption.
Interest Income Fell Even Though Liquid Assets Increased
The earlier explanation that lower interest income necessarily meant Data Patterns had deployed its cash into the business needs to be corrected.
The balance sheet does not support that conclusion.
At March 31, 2025:
- Investments: ₹326.55 crore
- Cash and cash equivalents: ₹37.64 crore
- Bank balances other than cash: ₹88.76 crore
At March 31, 2026:
- Investments: ₹328.85 crore
- Cash and cash equivalents: ₹56.85 crore
- Bank balances other than cash: ₹36.98 crore
Investments plus cash and cash equivalents increased from ₹364.19 crore to ₹385.70 crore. Even including other bank balances, the total remained broadly similar.
Yet interest income fell from ₹19.94 crore to ₹9.73 crore.
That suggests the decline cannot simply be explained by money leaving the balance sheet for capex or development.
A more defensible explanation is a change in the composition of liquid assets and the income earned on them. Bank balances fell by ₹51.78 crore while mutual-fund investments increased by ₹2.30 crore and cash increased by ₹19.21 crore.
The company was also using its QIP funds for business investment. By March 31, 2026, ₹131.19 crore of the ₹167.24 crore earmarked for product development had been utilised, along with ₹13.63 crore for the EMI-EMC facility.
But that should be viewed as a separate capital-allocation story, not as the direct reason for the ₹10.21 crore fall in interest income.
The Quality of Earnings Improved Quantifiably
This is where the decline in other income becomes less worrying.
Data Patterns’ FY26 PBT was ₹363.54 crore. Removing ₹27.96 crore of other income leaves ₹335.58 crore of PBT before other income.
In FY25, PBT was ₹295.34 crore. Removing ₹46.34 crore of other income leaves ₹249.00 crore.
That means:
- PBT excluding other income: ₹249.00 crore → ₹335.58 crore
- Growth: ₹86.58 crore or 34.77%
- Core PBT as a share of reported PBT: 84.31% → 92.31%
- Other income as a share of PBT: 15.69% → 7.69%
This is a meaningful change in earnings quality.
In FY25, nearly 16% of PBT came from other income. In FY26, that fell below 8%.
At the same time, revenue from operations increased 30.55%, from ₹708.35 crore to ₹924.77 crore.
The implication is straightforward: FY26 profit became much more dependent on the actual defence-electronics business and much less dependent on treasury and investment income.
For an investor, that is more important than the headline 39.68% decline in other income. Check our latest video for more details.
What Should Investors Assume for FY27?
The cleanest way to model FY27 is not to carry FY25’s ₹46.34 crore of other income forward.
There are three different buckets.
- Interest income- recurring, but variable
FY26 interest income was ₹9.73 crore. This is the most defensible starting point because it is generated from the company's financial assets, but the amount can change with deposits, investment mix and interest rates.
- Investment-sale gains- do not treat as recurring
FY26 profit on sale of investments was ₹22.21 crore. There is no basis to assume the same gain will repeat every year.
- Fair-value gains/losses- highly volatile
FY26 had a ₹7 crore loss, after a ₹15.43 crore gain in FY25. A base-case earnings model should therefore not depend on another fair-value gain.
A conservative modelling approach is consequently to anchor recurring other income around the ₹9.73 crore FY26 interest-income figure and assign no recurring benefit to investment-sale gains or fair-value movements unless visibility exists.
This does not mean FY27 other income will actually be ₹9.73 crore. It means the core business should not receive credit for investment gains that may not repeat.
How Much Operating Growth Is Needed If Other Income Falls Further?
The impact can be quantified.
FY26 PBT was ₹363.54 crore, including ₹27.96 crore of other income.
If the operating business remains otherwise unchanged:
- At ₹20 crore of other income, PBT would lose ₹7.96 crore. Operating PBT would need to rise by ₹7.96 crore to offset it.
- At ₹10 crore, the shortfall becomes ₹17.96 crore.
- At ₹0, the shortfall becomes ₹27.96 crore.
Using FY26 EBITDA of ₹371 crore as the reference, these gaps equal roughly:
- 2.15% of EBITDA at ₹20 crore other income
- 4.84% at ₹10 crore
- 7.54% at zero other income
This puts the issue into perspective.
Even if other income falls from ₹27.96 crore to ₹10 crore, the operating business does not need extraordinary growth to compensate. It needs an additional ₹17.96 crore of operating profit, assuming other costs remain unchanged.
That is why the key FY27 watchpoint should be operating revenue and EBITDA, not whether Data Patterns recreates FY25's investment gains.
The Real FY27 Watchpoint Is Capital Productivity
The ₹18.38 crore fall in other income is not the main financial risk.
The more important question is whether Data Patterns can turn its capital and technology investments into higher operating earnings.
The company had ₹328.85 crore invested in mutual funds at March 31, 2026, alongside ₹56.85 crore of cash and ₹36.98 crore of other bank balances. At the same time, ₹131.19 crore of QIP proceeds had already been used for product development.
That creates two separate pools of capital with two different jobs.
The mutual-fund portfolio can generate treasury income and investment gains. Product-development spending is intended to create future defence products and production revenue.
The FY27 test is therefore simple:
- Does revenue growth continue to come from the operating business?
- Does EBITDA remain strong as development products move toward production?
- Does capital deployed into product development generate commercial orders?
- Does other income remain a small part of PBT?
The fall in other income becomes a problem only if operating earnings cannot replace it.
If the core business continues growing, a lower other-income contribution is actually a sign that Data Patterns is becoming less dependent on investment income and more dependent on the business investors are actually buying the stock for.