What is P/E Ratio in Share Market?
When you hear investors talk about stocks, one term always pops up: P/E Ratio. If you’ve ever wondered, “What is P/E Ratio in share market?”, you’re in the right place. The P/E Ratio, or Price-to-Earnings Ratio, is a very common way investors use to find out whether a stock is cheap or expensive based on its earnings. It compares the current market price of a share to the profit (earnings) the company makes per share.
What Does P/E Ratio Actually Mean?
The P/E ratio shows how much money you are paying to earn ₹1 of profit from a company. Think of it like buying a fruit tree:
- You buy a mango tree for ₹1,000.
- That tree gives you ₹100 worth of mangoes every year.
- That means you’re paying ₹1,000 to earn ₹100/year.
Your P/E ratio = 1000 / 100 = 10.
This means you’re paying 10 times the annual income the tree gives you. This same idea applies to stocks. You’re paying a certain amount of money (share price) to get a certain amount of earnings (EPS or Earnings Per Share).
How to Calculate P/E Ratio?
The formula of the P/E ratio is given below:
P/ E Ratio = Market Value per Share / Earnings Per Share
Example 1:
- Share price of a company = ₹100
- Earnings per share = ₹10
- P/E Ratio = 100 ÷ 10 = 10
This means investors are ready to pay ₹10 to earn ₹1 from that company’s profits.
Real Examples of Indian Companies
Let’s take real examples from the Indian stock market:
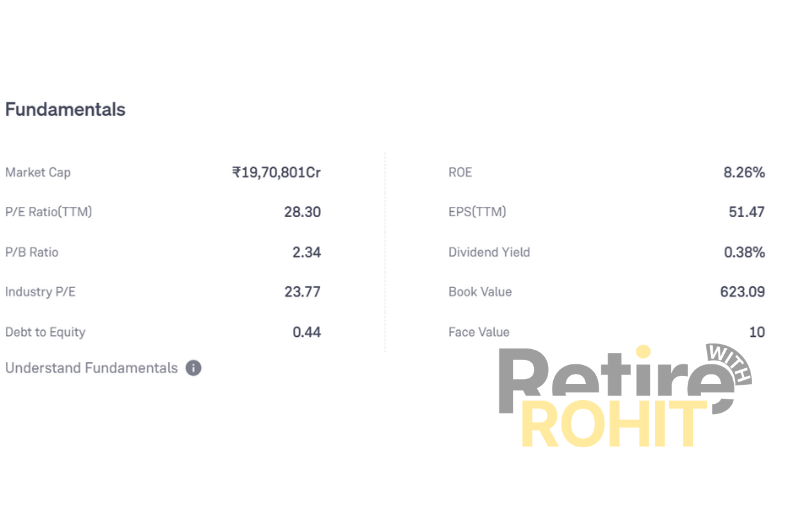
Reliance Industries
- Share Price = ₹1,450.80
- EPS = ₹51.47
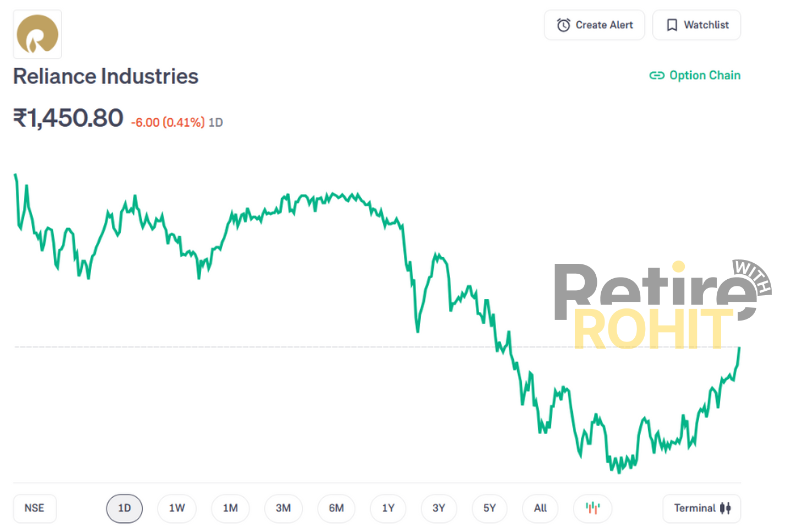
Using the P/ E ratio Formula:
P/ E Ratio = Market Value per Share / Earnings Per Share
= 1,450.80 ÷ 51.47 = 28.18 approx
What Does it Mean?
Investors are willing to pay ₹28.18 to earn ₹1 of Reliance's profit. This shows they believe Reliance will grow well in the future.
Tata Consultancy Services
- Share Price = ₹3,390.40
- EPS = ₹134.20
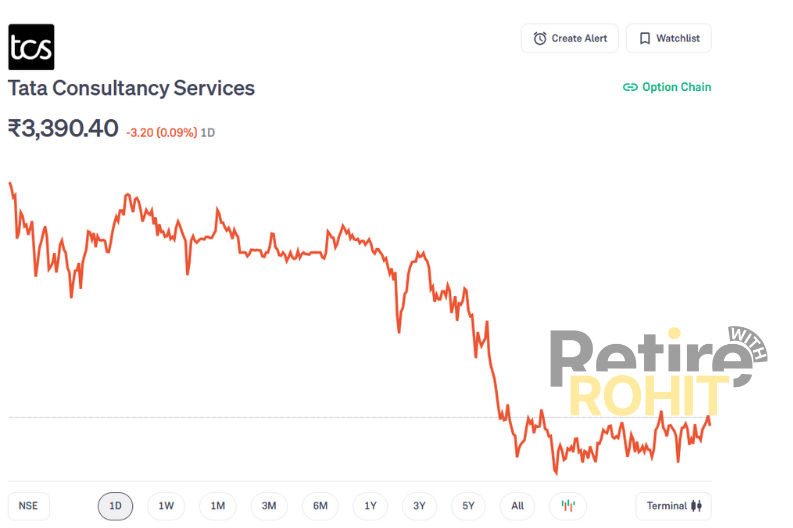
Using the P/ E ratio Formula:
P/ E Ratio = Market Value per share / Earnings Per Share
= 3,390.40 ÷ 134.20 = 25.26 approx
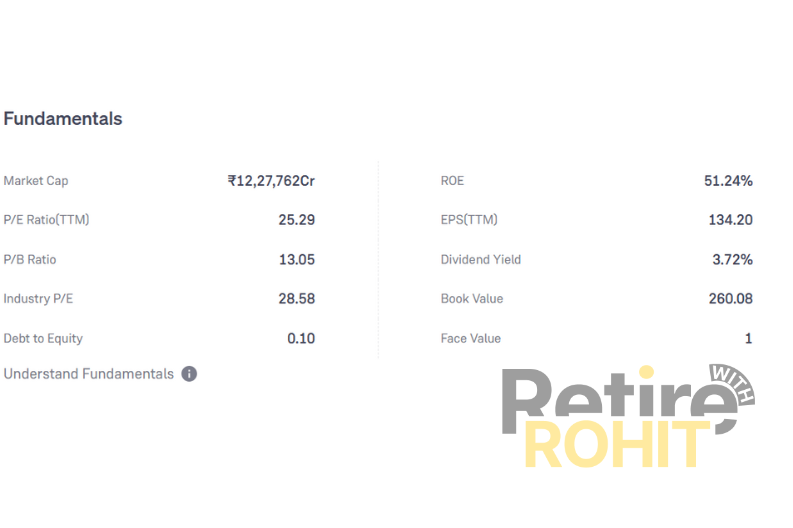
What Does it Mean?
Investors are paying more (₹25.26) to earn ₹1. Why? Because TCS is a strong tech company, and people expect high growth.
Types of P/E Ratio
Here are three types of P / E ratios:
- Forward P/ E Ratio: Based on expected future earnings, using analyst or company projections.
- Trailing P /E ratio: Based on past 12 months' earnings (most common and reliable).
- Shiller P/ E Ratio: Uses average earnings of the last 10 years to remove ups and downs.
Also, Check: What is Face Value of Share?
Why is the P/E Ratio Important?
Here, the P/ E ratio is important for many reasons:
- Checks if stock is overvalued or undervalued
A high P/E means the stock is expensive; people expect strong future growth.
A low P/E means the stock is cheap, but it could also mean the company is not growing or has problems. - Easy to compare with other companies
You can compare companies in the same industry to see which one gives better value for your money. - Gives an idea about market confidence
If many investors believe a company will grow, they’re ready to pay more (high P/E).
What is a Good P/E Ratio Number?
There is no one perfect P/E number that fits all stocks. A “good” P/E depends on many things, mainly the industry and the company’s growth potential. Why does it vary?
- Fast-growing companies (like tech or FMCG) usually have higher P/E ratios. Investors expect big future profits, so they’re willing to pay more today.
- Slower or stable companies (like banks or utilities) often have lower P/E ratios. Their growth is steady, so people won’t overpay.
Sector-wise P/E Difference
| Sector | Normal P/E Range |
| IT & Tech | 20-35 |
| FMCG | 30-50 |
| Banking | 10-20 |
| Auto Industry | 15-25 |
So, you can’t compare a bank’s P/E with a tech company’s P/E.
How to Know if a Stock’s P/E is Good?
Here’s a smart way to check if the stock might be a good deal:
1. Look at the stock’s own past P/E.
- Has it usually traded at a P/E of 25?
- Is it now at 18? That may mean it’s cheaper than usual.
2. Compare with similar companies in the same sector.
- If most auto companies are trading at 20 P/E and your stock is at 15, it might be undervalued.
3. Check NIFTY’s historical P/E range for market-level comparison. NIFTY’s P/E history:
- NIFTY has historically traded between 10 to 30 P/E
- The average over 20 years is around 20
So if NIFTY is trading below a P/E of 20, it could be a good time to invest, assuming other factors like earnings and the economy are also strong.
Rule:
- P/E below 20: May offer value (but check why it’s low)
- P/E above 30: May be overvalued (unless high growth is expected)
- Always look at industry standards and stock history
Pros and Cons of P/E Ratio
Pros: Why Investors Like the P/E Ratio
- Easy to Understand: The P/E ratio is simple math. Even beginners can use it to judge stock value.
- Quick Comparison Tool: You can easily compare two companies in the same sector. For example, if HDFC Bank has a P/E of 20 and ICICI Bank has a P/E of 15, you know ICICI is priced cheaper compared to its earnings.
- Shows Market Expectations: A high P/E means the market believes the company will grow more in the future. It helps you understand how confident people are about the company.
Cons: Where the P/E Ratio Fails
- Doesn’t Work if the Company is in the Loss: If a company is not making a profit (like Zomato in its early days), you can’t calculate P/E at all.
- Earnings Can Be Misleading: Sometimes, companies show higher profits for one quarter because of a one-time income (like selling an asset). This artificial boost can make the P/E ratio look better than it really is.
- Ignores Debt and Risk: A company might have good earnings, but also a lot of debt. P/E doesn’t show that. So, it gives an incomplete picture of the company’s real health.
How to Use P/E Ratio for Investing?
The P/E ratio is a helpful tool, but only if you use it the right way. Here's how beginners should use it smartly:
Compare Companies in the Same Sector
Don’t compare completely different types of companies.
- Compare HDFC Bank with ICICI Bank
- Don’t compare HDFC Bank with TCS; their businesses and growth models are totally different.
Every industry has its own normal P/E range. So, comparing inside the same sector gives you a fair idea.
Check the Stock’s Historical P/E
Look at how the stock’s P/E was in the past:
- Is the current P/E lower than its usual range? That might mean the stock is undervalued.
- Is it much higher than normal? It could be overpriced, unless the company is expected to grow a lot.
Use websites like Moneycontrol or Screener to check a stock’s P/E history.
Understand Future Growth
A high P/E is not always bad. It might mean people believe the company will grow fast in the future. For example, TCS or Asian Paints may have a high P/E, but they also show steady profit growth year after year.
So, always ask: Is this company expected to grow enough to justify this price?
Use Other Tools Too
Don’t only depend on the P/E ratio. It’s just one tool in your investing toolbox. Also check:
- The company’s debt level
- Management quality
- Future plans
- Profit consistency
- Other ratios like PEG, P/B, and Dividend Yield
Common Mistakes to Avoid When Using P/E Ratio
Many new investors make the same errors while using the P/E ratio. Here’s what you should not do:
Thinking Low P/E Always Means the Stock is Cheap
A low P/E may look attractive, but it doesn’t always mean a good investment. Why? The company might be:
- Losing market share
- Facing legal or financial issues
- Growing very slowly
So always ask: Why is the P/E low? Is the business strong, or is the stock cheap for a reason?
Comparing Companies from Different Sectors
Don’t compare an IT company with a bank or a pharma company with an FMCG stock. Why? Each industry has different profit margins, business models, and growth expectations. So their P/E ratios are naturally different. Always compare within the same sector to make the P/E ratio meaningful.
Using P/E for Loss-Making or New Companies
If a company is making losses, its earnings per share (EPS) are negative. This means the P/E ratio cannot be calculated or will be misleading.
For example:
- Startups like Zomato or Paytm (in their early years)
- Companies going through financial troubles
In such cases, ignore the P/E and look at other factors like revenue growth, cash burn, and market potential.
Ignoring Debt and Financial Health
P/E looks only at earnings, not at how much debt the company has. A company may show good profits but may also be heavily in debt, which is risky. Always check:
- Debt-to-equity ratio
- Cash flows
- Profit consistency
Conclusion
In conclusion, the P/E Ratio in the share market is a simple and powerful way to judge a stock’s value. It tells you how much you are paying to earn ₹1 of company profit. But like any tool, it works best when used with others. Just like you check the price, mileage, and reviews before buying a car, do the same before buying a stock. P/E is your starting point, not a full story.
Check Other Post Posts
-
 What is Face Value of Share?
December 10, 2024
-
How to Open Union Bank Statement PDF Password?
September 1, 2024
-
ICICI Bank Full Form and History
April 24, 2025