Can Max Healthcare Double Its Bed Capacity Without Hurting Profits?
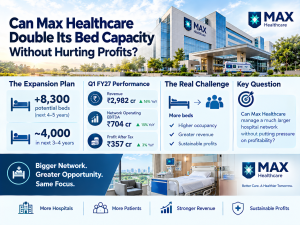
Max Healthcare is preparing for a major expansion that could nearly double its bed capacity over the next four to five years. The company has identified potential to add around 8,300 beds, with approximately 4,000 planned over the next three to four years. However, the financial challenge is not simply building hospitals. It is converting the new capacity into occupied beds, sustainable earnings and returns that justify the investment.
The financial results already show why this matters. In Q1 FY27, Max Healthcare's network revenue increased 16% year-on-year to ₹2,982 crore, while operating EBITDA grew 15% to ₹704 crore. Profit after tax rose just 3% to ₹357 crore. Higher depreciation and finance costs following the commissioning of additional capacity contributed to the slower profit growth.
The question is whether Max can manage this transition while protecting its margins and balance sheet. The answer depends on five factors: the revenue potential of new beds, the cost of commissioning hospitals, the pace of cash generation, the performance of newer facilities and the speed at which occupancy improves.
What Could 4,000 Additional Beds Earn?
Max Healthcare's expansion schedule estimates cash outflows of ₹6,961 crore for projects covered through FY30. This excludes land costs, routine capital expenditure at existing hospitals and spending on potential future bed additions. The company has also identified approximately 8,300 beds of potential capacity, although not all of these additions are formalised for the same period.
The earnings opportunity can be modelled using the company's Q1 FY27 average revenue per occupied bed (ARPOB) of ₹81,900. However, this is a scenario rather than a forecast because new hospitals will take time to attract patients and reach mature occupancy.
Analyst modelling: annual revenue potential of 4,000 beds
| Occupancy assumption | Occupied beds equivalent | Annual gross revenue |
| 30% | 1,200 | ₹3,587 Cr |
| 50% | 2,000 | ₹5,978 Cr |
| 70% | 2,800 | ₹8,369 Cr |
Method: 4,000 beds × 365 days × assumed occupancy × ₹81,900 ARPOB. Assumes all 4,000 beds are operational for a full year and that the Q1 FY27 ARPOB remains unchanged. These are illustrative steady-state scenarios, not management guidance or estimates of revenue during the commissioning period.
The EBITDA contribution depends on how efficiently the new hospitals operate. Applying illustrative EBITDA margins of 5%, 10% and 15% produces the following results.
| Occupancy | EBITDA at 5% margin | At 10% margin | At 15% margin |
| 30% | ₹179 Cr | ₹359 Cr | ₹538 Cr |
| 50% | ₹299 Cr | ₹598 Cr | ₹897 Cr |
| 70% | ₹418 Cr | ₹837 Cr | ₹1,255 Cr |
These margins are analyst assumptions, not disclosed forecasts. Actual results could be lower during the initial ramp-up because staffing, utilities, maintenance and other operating expenses may rise before patient volumes reach sufficient scale.
The distinction is important. The table shows the potential of 4,000 beds once operational for a full year; it does not imply that Max will generate these amounts immediately after commissioning. The actual revenue contribution through FY27–FY30 will depend on when individual beds become operational and how quickly occupancy increases.
Why Is PAT Growing Much More Slowly Than EBITDA?
Max Healthcare's Q1 FY27 financial statements help explain the pressure that expansion can create.
| Financial metric | Q1 FY26 | Q1 FY27 | Change |
| Network operating EBITDA | ₹613 Cr | ₹704 Cr | +₹91 Cr |
| Finance costs, net | ₹34 Cr | ₹61 Cr | +₹27 Cr |
| Depreciation and amortisation | ₹117 Cr | ₹150 Cr | +₹33 Cr |
| Profit before tax | ₹441 Cr | ₹472 Cr | +₹31 Cr |
| Tax | ₹96 Cr | ₹115 Cr | +₹19 Cr |
| Profit after tax | ₹345 Cr | ₹357 Cr | +₹12 Cr |
Source: Max Healthcare's Q1 FY27 disclosures. Figures are in ₹ crore.
Operating EBITDA increased by ₹91 crore, but higher finance costs and depreciation absorbed ₹60 crore of that increase. Consequently, profit before tax rose by ₹31 crore. Higher tax expense then reduced the increase in PAT to ₹12 crore.
The company specifically attributed the slower PAT growth partly to higher depreciation and finance costs following the commissioning of brownfield capacity at Max Smart, Nanavati-Max and Mohali.
The disclosures quantify the year-on-year increase in these expenses, but they do not isolate the exact amount attributable to each hospital. Therefore, the ₹33 crore increase in depreciation and ₹27 crore increase in finance costs should not be treated as entirely arising from new hospitals.
The broader message is clear: a hospital can begin generating revenue and EBITDA before it contributes proportionately to PAT. Capital-intensive expansion increases the depreciation charge, while borrowing and financing arrangements can increase interest costs.
Investors should watch whether the earnings contribution from these facilities grows sufficiently to absorb those additional expenses. Otherwise, EBITDA growth may continue to translate into relatively slower growth in reported profit.
Can Internal Cash Generation Cover the Expansion?
Max Healthcare generated ₹397 crore in free cash from operations in Q1 FY27 and reported net debt of ₹2,384 crore as of June 30, 2026. The company has indicated that its cash generation and balance sheet provide room to support future growth.
However, the planned investment programme is substantial relative to quarterly cash generation.
Illustrative funding comparison
If quarterly free cash from operations remained at ₹397 crore for four years, cumulative generation would be approximately ₹6,352 crore.
| Funding indicator | Amount |
| Q1 FY27 free cash from operations | ₹397 Cr |
| Annualised cash generation at the same rate | ₹1,588 Cr |
| Illustrative four-year cumulative generation | ₹6,352 Cr |
| Estimated expansion outflows through FY30 | ₹6,961 Cr |
| Difference before additional funding requirements | ₹609 Cr |
This is a simple analyst illustration, not a forecast of Max Healthcare's future cash flow or a confirmed funding shortfall. It assumes the Q1 FY27 quarterly figure continues unchanged for four years. Actual cash generation could rise or fall.
The comparison also needs several qualifications. The expansion outflow estimate excludes land costs and routine capital expenditure at existing hospitals. Although the free-cash-flow measure already accounts for routine replacement capital expenditure, the company must still fund land purchases, dividends and other investment commitments where applicable. Existing debt obligations and changes in working capital can also affect cash available for expansion.
Consequently, the ₹609 crore difference should not be interpreted as the amount Max must borrow. It indicates how closely the disclosed project outflows compare with a simple, flat cash-generation scenario before those additional requirements.
The funding position will depend on the actual commissioning schedule, future operating performance and spending discipline. Higher cash generation could reduce reliance on borrowing, while cost overruns or slower hospital ramp-ups could increase it.
For investors, quarterly free cash from operations and net debt are therefore as important as reported PAT. The expansion needs to generate enough cash over time to fund both new projects and the existing network.
Which New Hospitals Are Pressuring Returns?
Max Healthcare reported overall pre-tax return on capital employed (ROCE) of 20% in Q1 FY27. Excluding units less than four years old and capital work in progress, ROCE was 29.2%.
This difference suggests that newer facilities and projects still under development are weighing on the overall return calculation. However, the disclosed figures do not provide enough information to attribute the entire difference to individual hospitals.
The available operating disclosures offer a more specific view of certain facilities.
| Facility or project | Disclosed position | What investors should monitor |
| MSSH Bhubaneswar | 250 beds; 50% occupancy and ₹35,000 ARPOB during the post-acquisition period in Q1 FY27; revenue of ₹19 Cr and EBITDA of approximately ₹2 Cr | Consultant hiring, occupancy, patient mix and integration into Max's operating model |
| Max Smart, Saket | 202 beds in the new brownfield tower operationalised; the remaining 198 beds were scheduled for phased handover during Q2 FY27 | Commissioning progress, patient volumes and incremental earnings |
| Nanavati-Max, Mumbai | Additional beds were being commissioned as part of the expansion programme | Occupancy growth and the contribution of additional capacity to earnings |
| Mohali | Commissioned brownfield capacity contributed to higher depreciation and finance costs at the network level | Utilisation, EBITDA contribution and improvement in returns on invested capital |
| MSSH Vaishali | A ₹425 crore brownfield tower approved to add 202 beds to the existing 387-bed capacity; commissioning expected in Q4 FY30 | Construction costs, timely commissioning and subsequent occupancy ramp-up |
Source: Max Healthcare's Q1 FY27 disclosures. Hospital-wise EBITDA, commissioning dates and maturity targets are not all disclosed on a comparable basis.
Bhubaneswar provides a useful example of why occupancy and earnings must be examined together. Its 50% occupancy and ₹35,000 ARPOB during the post-acquisition quarter were below the wider network's Q1 FY27 ARPOB of ₹81,900. However, the two figures relate to different operating circumstances and patient mixes, so the comparison alone does not establish whether the hospital is structurally underperforming.
Max is working to improve Bhubaneswar's clinician base, occupancy and payer mix while integrating its clinical, procurement, finance and digital systems. These actions could improve the hospital's contribution, but the disclosures do not specify a date for breakeven or full maturity.
The same discipline is needed for other new facilities. Without comparable hospital-level EBITDA, capital employed and maturity timelines, investors should avoid assigning precise return targets to individual hospitals.
The relevant test is whether each facility's operating performance improves as it moves beyond its initial ramp-up period.
What Happens If Occupancy Ramps Up More Slowly?
The expansion's financial outcome depends heavily on how quickly new beds become occupied. The revenue sensitivity in the first section shows the scale of this relationship: at the same ARPOB, moving from 30% to 70% occupancy increases the illustrative annual revenue potential of 4,000 beds from ₹3,587 crore to ₹8,369 crore.
However, slower occupancy can create a double pressure on profitability. Revenue remains lower, while staffing and facility costs may not decline proportionately because hospitals need a minimum level of personnel and infrastructure to operate safely.
The following sensitivity illustrates how different EBITDA margins affect the result.
| Occupancy | Revenue | EBITDA at 5% margin | EBITDA at 10% margin | EBITDA at 15% margin |
| 30% | ₹3,587 Cr | ₹179 Cr | ₹359 Cr | ₹538 Cr |
| 50% | ₹5,978 Cr | ₹299 Cr | ₹598 Cr | ₹897 Cr |
| 70% | ₹8,369 Cr | ₹418 Cr | ₹837 Cr | ₹1,255 Cr |
All figures are analyst scenarios for 4,000 beds operating for a full year. The margins are illustrative assumptions, not management guidance. The model excludes differences in specialty mix, pricing, commissioning dates and hospital-specific costs.
The stress case is a combination of low occupancy and a low EBITDA margin. At 30% occupancy and a 5% margin, illustrative EBITDA is ₹179 crore. If the same beds achieve 70% occupancy and a 15% margin, the figure rises to ₹1,255 crore.
These numbers should not be read as expected outcomes. They demonstrate the sensitivity of earnings to utilisation and cost control.
Max's existing network reported an operating EBITDA margin of 24.8% in Q1 FY27. Applying that mature-network margin to all 4,000 beds would produce a much higher theoretical EBITDA contribution, but it would ignore the costs and ramp-up period of new hospitals. It would therefore be inappropriate to use that margin as the base case for newly commissioned capacity.
Mature hospitals can help support group profitability by generating cash and earnings while new units develop. But the strength of the established network cannot indefinitely compensate for weak utilisation or excessive costs in new facilities. The new capacity must eventually demonstrate its own ability to generate adequate returns.
Conclusion: The Test Is Profitable Capacity, Not Just More Beds
Max Healthcare's plan to add around 4,000 beds over the next three to four years creates a substantial opportunity, but it also introduces investment, financing and operating risks.
The analyst scenarios show that the revenue potential can be significant once all the beds are operational. Yet the timing of commissioning, occupancy ramp-up and the ability to maintain margins will determine how much of that potential becomes earnings.
Q1 FY27 offers an early reminder of the challenge. Operating EBITDA increased by ₹91 crore year-on-year, but higher depreciation and finance costs absorbed ₹60 crore of that increase, while higher tax expense further limited PAT growth.
The funding comparison also suggests that the expansion will require careful capital allocation. A flat cash-generation illustration comes close to, but does not fully cover, the disclosed project outflows before land costs and other cash commitments are considered. It does not establish a definite funding gap, but it highlights the importance of monitoring cash flow and debt as the programme advances.
For investors, the most useful indicators will be occupied bed days, hospital-level profitability where disclosed, operating margins, free cash from operations, net debt and returns on capital.
Max Healthcare can add capacity without permanently hurting profitability only if its new hospitals move from investment-heavy ramp-up periods to productive operations at a pace that justifies the capital committed. The number of beds is the starting point; the returns those beds ultimately generate will determine whether the expansion creates value.