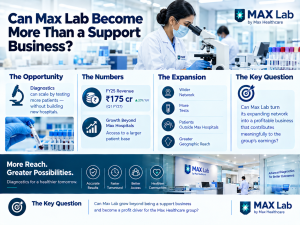
Can Max Lab Become More Than a Support Business?
A diagnostics business can grow without adding hospital beds, but building a large network is only half the challenge. The real test is whether that network can generate attractive profits and cash returns on the capital invested.
Max Lab, the diagnostics arm of Max Healthcare, is showing encouraging growth. It generated ₹175 crore in FY25 net revenue, while its non-captive pathology business reported ₹58 crore in gross revenue in Q1 FY27, up 20% year-on-year. Its presence across 50-plus cities, supported by laboratories and collection partners, gives it a platform to reach patients beyond Max Healthcare’s hospitals.
However, Max Lab’s standalone profitability, capital employed and cash generation are not disclosed in enough detail to establish its full economic contribution. The opportunity is real, but investors need to distinguish the growth already achieved from the earnings that may emerge over the next three years.
What Could Max Lab Contribute to Group Earnings?
Max Lab’s FY25 net revenue of ₹175 crore establishes a meaningful starting point. Its Q1 FY27 gross revenue of ₹58 crore indicates continued momentum, although gross revenue and net revenue are different measures and should not be compared directly without reconciling their definitions.
To understand the potential earnings contribution, the following scenarios model how Max Lab could grow through FY30.
Illustrative FY28-FY30 revenue and EBITDA scenarios
The model uses ₹232 crore as a FY27 annualised revenue proxy, calculated by multiplying Q1 FY27 gross revenue of ₹58 crore by four. This is a run-rate assumption, not reported FY27 revenue or management guidance. All projected figures below are analyst estimates.
| Financial year | Conservative scenario: 15% growth, 10% EBITDA margin | Base scenario: 20% growth, 15% EBITDA margin | Upside scenario: 25% growth, 20% EBITDA margin |
| FY28 revenue | ₹267 Cr | ₹278 Cr | ₹290 Cr |
| FY28 EBITDA | ₹27 Cr | ₹42 Cr | ₹58 Cr |
| FY29 revenue | ₹307 Cr | ₹334 Cr | ₹363 Cr |
| FY29 EBITDA | ₹31 Cr | ₹50 Cr | ₹73 Cr |
| FY30 revenue | ₹353 Cr | ₹401 Cr | ₹453 Cr |
| FY30 EBITDA | ₹35 Cr | ₹60 Cr | ₹91 Cr |
Source: Analyst modelling based on the stated annualised Q1 FY27 revenue proxy, growth assumptions and EBITDA margins. Figures are rounded. The scenarios are illustrative, not forecasts.
The model shows that Max Lab could generate FY30 EBITDA of ₹35-91 crore under these assumptions. The range is wide because both revenue growth and profitability remain uncertain.
The margin assumptions are not arbitrary proof of future performance: Max Lab’s historical disclosed quarterly EBITDA margins ranged from 6% to 17% across the quarters shown from Q3 FY24 to Q4 FY25. The higher scenario therefore requires sustained improvement beyond the lower end of that historical range.
EBITDA is also not the same as profit after tax. Depreciation, financing costs, taxes and working-capital requirements would determine how much of this operating profit ultimately reaches shareholders. Without standalone financial statements and capital-employed data, a reliable PAT or return-on-capital estimate cannot be made.
Is Max Lab Becoming More Independent of Hospitals?
The strongest evidence of Max Lab’s external growth is its non-captive pathology revenue. Unlike tests arising from patients already visiting Max Healthcare hospitals, this business serves customers outside the hospital network.
The disclosed figures show a clear growth trajectory:
- FY25: Max Lab generated ₹175 crore in net revenue, up from ₹144 crore in FY24.
- Q1 FY26: Non-captive pathology revenue was ₹48 crore.
- Q2 FY26: Revenue increased to ₹54 crore.
- Q3 FY26: Revenue was ₹47 crore.
- Q4 FY26: Revenue reached ₹52 crore, up 14% year-on-year.
- Q1 FY27: Revenue rose to ₹58 crore, up 20% year-on-year and 11% quarter-on-quarter.
The FY26 quarterly figures add up to ₹201 crore. However, this should be treated as a sum of the reported quarterly revenue figures, not automatically as comparable with FY25’s ₹175 crore net revenue: the disclosures use different revenue descriptions, and a reconciliation would be needed before calculating a precise annual growth rate.
The Q1 FY27 growth rate is more straightforward because it compares the same reported revenue measure across corresponding quarters.
The remaining question is how much of Max Lab’s total activity comes from external patients compared with samples processed within Max Healthcare hospitals. The company’s presentation separately identifies non-captive pathology and describes a 60:40 revenue-sharing arrangement for samples tested in hospital laboratories from FY23 onwards. But the available disclosures do not provide a complete, comparable split of external and hospital-linked revenue for FY25 through Q1 FY27.
That missing split matters. External revenue growth would demonstrate a more independent customer franchise; a business still heavily dependent on hospital-linked samples would have a different growth profile and economics. Max Lab is clearly expanding outside the network, but the disclosed figures do not yet quantify its full degree of independence.
Is Operating Leverage Actually Improving?
Diagnostics businesses can benefit from operating leverage. Laboratory equipment, technology systems, quality-control processes and specialised staff create costs that do not rise in direct proportion to every additional test. If sample volumes increase while these costs grow more slowly, margins can improve.
Max Lab has some evidence of this possibility. Its disclosed quarterly EBITDA margin rose from 6% in Q3 FY24 to 17% in Q2 FY25 before settling at 14% in Q4 FY25. This shows that the business has achieved better quarterly margins than it recorded earlier in the period.
However, that history does not establish a sustained operating-leverage trend. The available figures do not provide a consistent series for test volumes, laboratory utilisation, revenue per laboratory or growth in employee and processing costs. Without these measures, it is difficult to determine whether margin changes resulted from higher volumes, pricing, test mix, cost control or other factors.
The latest revenue growth is encouraging, but it is not enough by itself to prove that costs are growing more slowly than revenue.
Investors should look for three disclosures in future results: external test volumes, EBITDA margins on a consistent revenue basis, and laboratory-level productivity. If revenue continues to rise while margins improve, the operating-leverage thesis will gain credibility. Until then, it remains plausible but unproven.
How Does Max Lab Compare With Established Diagnostic Chains?
Max Lab competes in a market where established diagnostic companies already have substantial laboratory networks, customer relationships and scale advantages.
FY26 provides a useful benchmark for the financial performance of three listed players.
| Company | FY26 revenue from operations | FY26 EBITDA | EBITDA margin | Network reach |
| Dr Lal PathLabs | ₹2,760 Cr | ₹596 Cr | 21.6% | 312 labs; 7,727 patient service centres |
| Metropolis Healthcare | ₹1,646 Cr | ₹401 Cr | 24.4% | 221+ labs; around 5,000 patient service centres |
| Thyrocare Technologies | ₹829 Cr | Not stated here on a directly comparable basis | — | Large partner-led pathology network |
| Max Lab | ₹175 Cr FY25 net revenue; Q1 FY27 gross revenue of ₹58 Cr | Standalone FY26 EBITDA not disclosed on a comparable basis | — | 50+ cities, 45+ laboratories and 1,200+ active partners in the FY25 presentation |
Sources: company FY26 results and annual-report disclosures; Max Healthcare’s FY25 investor presentation and Q1 FY27 results. Dr Lal’s FY26 revenue and EBITDA figures are consolidated, while Metropolis figures are group results. Max Lab’s figures use different periods and revenue definitions, so the table is a scale comparison rather than a like-for-like valuation comparison.
The difference in scale is substantial. Dr Lal PathLabs processed 94.5 million samples in FY26 and operated 312 laboratories, while Metropolis reported a network spanning more than 750 towns and over 4,100 tests and profiles. Both companies have built broad networks that serve individual patients, healthcare providers and other customers.
Their margins also show what an established diagnostics platform can achieve. Dr Lal PathLabs reported a 21.6% FY26 EBITDA margin, while Metropolis reported 24.4%. These are benchmarks, not reasonable assumptions to apply automatically to Max Lab: the companies differ in scale, network mix, business model and reporting basis.
Max Lab’s advantage is its connection to Max Healthcare’s clinical brand, hospital relationships and patient ecosystem. Its external network can use that reputation to attract customers and expand reach. But a genuine competitive advantage must eventually show up in measurable outcomes: patient acquisition, test volumes, repeat business, realisations, margins and returns on capital.
Max Lab has demonstrated reach and growth. It has not yet disclosed enough comparable data to establish that it has the same scale economics as the established chains.
Is Expansion Really Capital-Light?
Max Healthcare categorises Max Lab under its “Capital Light Adjacencies” strategy. The label makes sense in principle: collection partners and pick-up points can extend geographic reach without requiring a full testing laboratory at every location.
The FY25 presentation reported that Max Lab operated in more than 50 cities, with over 45 laboratories, more than 1,200 active partners, over 520 collection centres and more than 570 pick-up points. This partner network provides a route to expand access without building every part of the customer-facing infrastructure itself.
But capital-light does not mean capital-free. Diagnostic operations still require testing equipment, laboratory fit-outs, information systems, quality assurance, trained personnel, sample transportation and maintenance. Growth can also tie up cash in receivables, supplies and payments to collection partners.
The available disclosures do not isolate Max Lab’s annual capital expenditure, equipment spending, working-capital investment or operating cash flow. Consequently, the capital required to support each increment of revenue and the return earned on that investment cannot be calculated reliably.
The distinction matters because two businesses can report the same revenue growth but produce very different shareholder returns. One may expand largely through existing capacity and partner relationships; the other may need substantial new equipment, facilities and working capital to support the same growth.
For Max Lab, the evidence supports a partner-led expansion model. It does not yet prove that the model is delivering attractive capital efficiency. Investors need a separate disclosure of capital expenditure, cash conversion and capital employed before treating the “capital-light” label as evidence of high returns.
What Investors Should Watch Next
Max Lab’s next phase should be judged by more than its quarterly revenue growth. Five indicators would help investors assess whether it is becoming a meaningful standalone business:
- External revenue mix: A consistent disclosure of non-captive revenue alongside hospital-linked activity.
- Profitability: Standalone EBITDA, EBITDA margin and profit after tax on a comparable basis.
- Operating leverage: Test volumes, laboratory utilisation and cost growth relative to revenue.
- Capital efficiency: Capital expenditure, working-capital movement, operating cash flow and return on capital employed.
- Competitive positioning: Evidence that Max Lab is gaining customers and improving productivity while narrowing the scale gap with established diagnostic chains.
These metrics would help distinguish growth driven by a larger network from growth that produces durable earnings and cash.
Conclusion: Growth Is Visible; Returns Still Need Proof
Max Lab has moved beyond being merely a hospital laboratory. Its external network spans more than 50 cities, its FY25 net revenue reached ₹175 crore, and non-captive pathology revenue rose to ₹58 crore in Q1 FY27.
The opportunity is to build on Max Healthcare’s brand and clinical ecosystem while reaching more customers outside its hospitals. Under illustrative analyst assumptions, Max Lab could generate ₹353-453 crore in FY30 revenue and ₹35–91 crore in EBITDA. These outcomes depend on sustained growth and margins that have not yet been demonstrated at that scale.
The investment case will become stronger when Max Healthcare discloses Max Lab’s standalone profitability, external revenue share, cash generation and capital employed. Until then, Max Lab is a promising growth business but its potential contribution to group earnings and returns remains only partly visible.