Understanding The Ascending Triangle Pattern For Technical Analysis
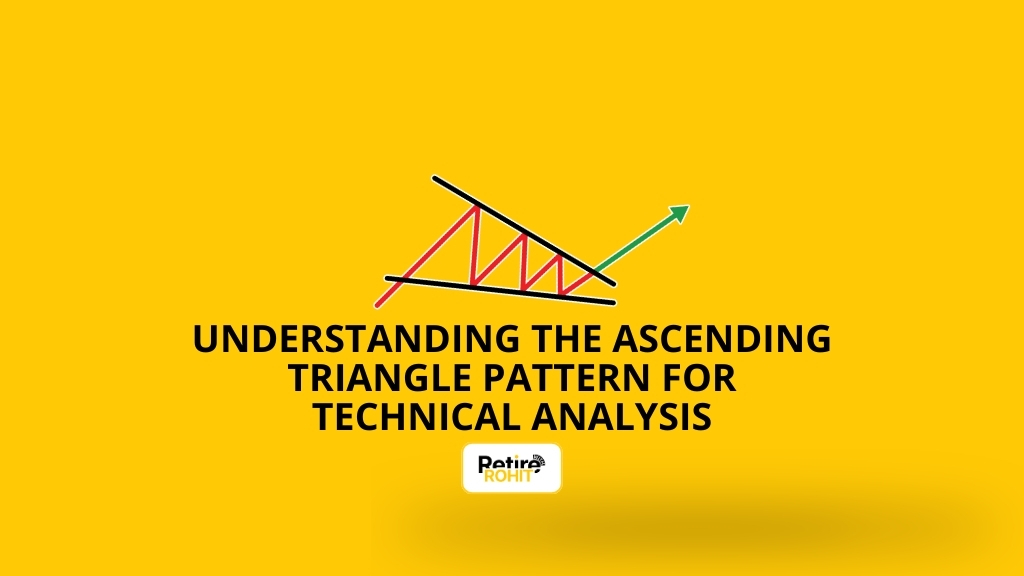
It’s a chart shape. Yes, just a triangle. The price of a stock goes up, but it keeps hitting a wall. It tries again and again, but can’t break it. At the same time, the price doesn’t fall too much; each time it drops, it falls a little less. So, the stock is stuck between a ceiling and a rising floor. After a few tries, the pressure builds up, and finally. The price breaks through the ceiling and shoots up. That’s an ascending triangle pattern.
How Is the Ascending Triangle Formed? And What Does It Mean?
ChatGPT
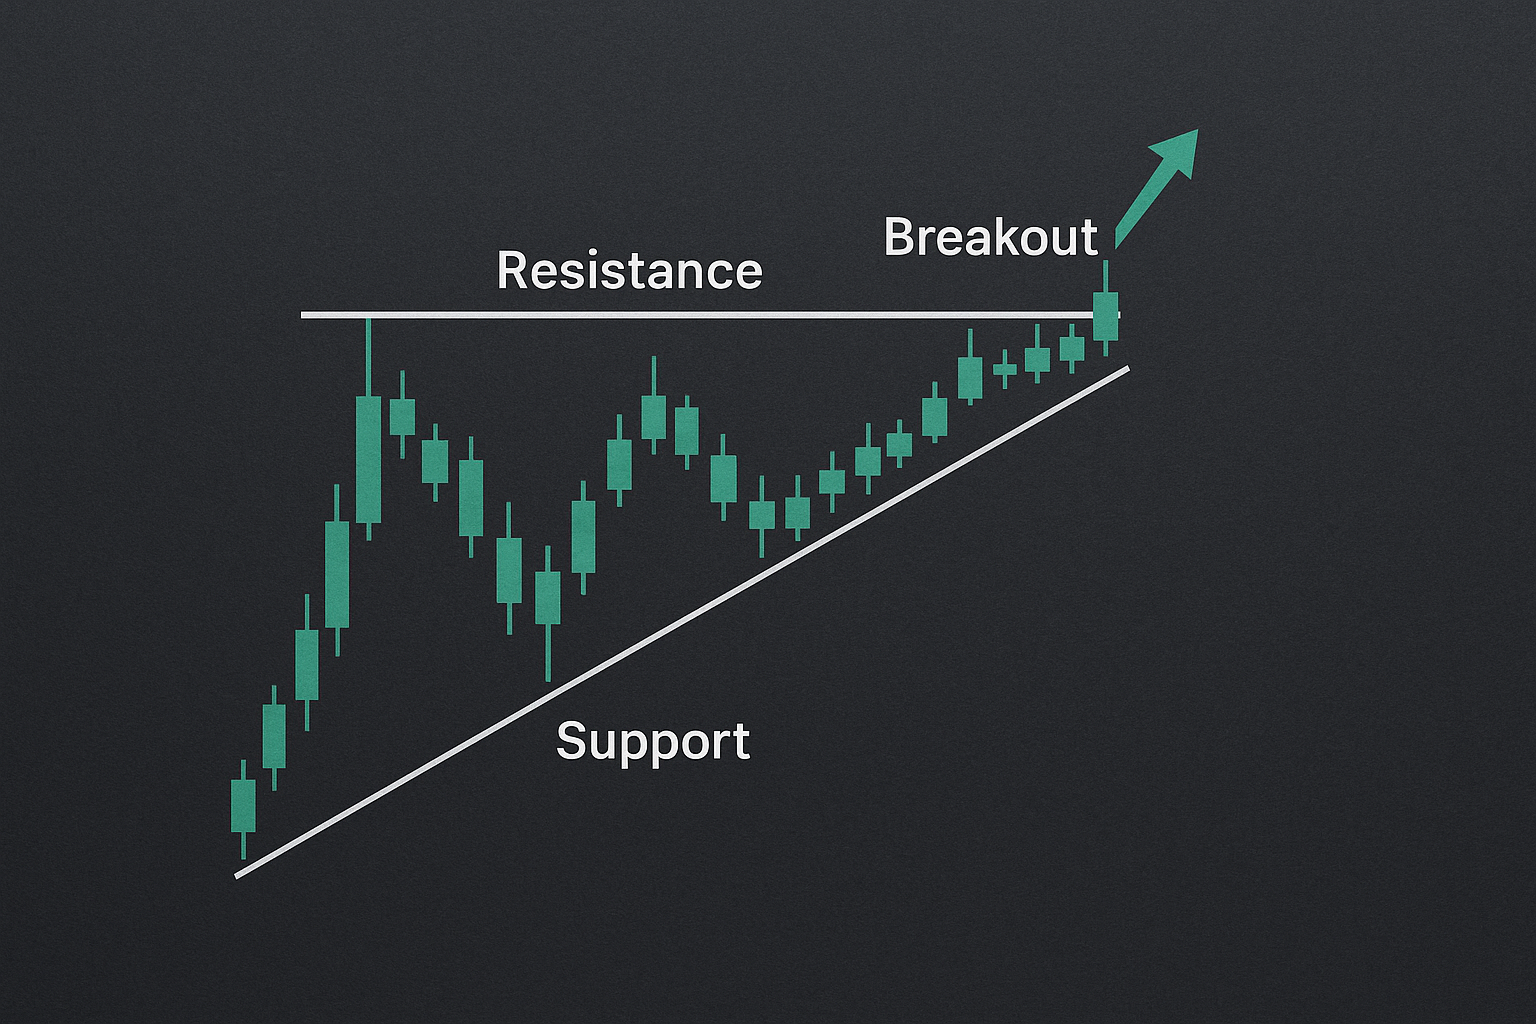
This pattern is made with two simple lines on the chart:
- Flat Top Line (Resistance): The price keeps going up and hitting the same level again and again, but it doesn’t cross it. This level is called the resistance.
- Sloping Bottom Line (Support): After each time the price falls down, it doesn’t go as low as before. Each time it comes down, it stops at a higher point. Connect these points, and you get a rising line.
Now, if you look at the chart, this shape looks like a triangle. Flat on the top, and rising on the bottom. That’s why it’s called an ascending triangle.
What Does It Tell Us?
This pattern usually happens when a stock is already going up (uptrend), but then it takes a small break and moves sideways for some time. That break is called consolidation. But here’s the interesting part:
- Every time the price hits the top (resistance), it fails to go higher.
- But the buyers are not giving up. Each time it comes down, they buy again, and they buy even faster, not letting the price fall too much.
This shows buyers are getting stronger and sellers are getting weaker. So, what happens next? When the buyers become too strong, they break the resistance, and the price shoots up. That’s called a breakout.
Key Features of the Ascending Triangle Pattern
Here are the main things to know about this pattern:
- Starts with a Strong Uptrend: Before the triangle forms, the stock should already be going up. This shows that buyers are in control from the beginning.
- Price Takes a Small Break (Consolidation): After the uptrend, the price doesn't keep going up straight. It moves sideways for a bit. This is called a pause or consolidation. During this time, buyers and sellers are fighting. But buyers slowly get stronger.
- Breakout Happens: When the price finally crosses the top line (resistance) with power and volume, that’s called a breakout. This is the moment traders look for to enter the trade, set a stop-loss, and plan their profit.
Pros and Cons of the Ascending Triangle Pattern Chart
There are quite a few pros and cons to discuss about this pattern chart. Have a look at them below:
Pros:
- Easy to Spot: It has a clear triangle shape, so even beginners can see it on charts.
- Gives Clear Entry & Exit: Once the breakout happens, traders can easily plan where to enter, where to keep stop-loss, and when to book profits.
- Supports the Trend: This pattern usually continues the uptrend, which means the stock is likely to keep moving up.
- Helps Understand Market Mood: It shows that buyers are getting stronger and ready to push prices higher.
Cons:
- Fake Breakouts Happen: Sometimes, the price goes above resistance and then suddenly drops again. This is called a false breakout.
- Not Always Perfect: The pattern may not look exactly like a triangle. It can be a little messy, which can confuse beginners.
- No Guarantee: Even if the pattern looks strong, the price can still go the other way. Markets are unpredictable.
Conclusion
In Conclusion, the ascending triangle is like buyers keep pushing. Sellers hold. Finally, breakout. This pattern helps you:
- Enter trades at the right time
- Catch upward moves
- Stay away from bad trades (if used with volume and RSI)
Check Other Post Posts
-
 What is ICICI Pockets?
March 3, 2025
-
Bank of Baroda Net Banking – How to Register for it?
November 5, 2024
-
How to Activate a New Axis Bank Debit Card Online?
November 7, 2024