Aarti Industries: Revenue Doubled but Profit Is Flat. Why?
For a speciality chemicals company, doubling the size of the business should normally create a much larger profit pool. Aarti Industries’ numbers show why that assumption can be dangerous.
The company’s consolidated gross income increased from ₹4,621 crore in FY20 to ₹9,018 crore in FY26- an increase of ₹4,397 crore. Yet consolidated PAT moved in the opposite direction: from ₹536 crore in FY20 to ₹419 crore in FY26. In other words, the business generated nearly twice the revenue but ₹117 crore less profit than it did six years earlier.
So where did the additional revenue go?
The answer is not that Aarti stopped growing. The company expanded capacity, entered new products and increased its market presence. The problem was that the economics of growth deteriorated. Raw-material volatility, Chinese competition, weak demand in some value chains, lower utilisation, pricing pressure and a rising cost of capital prevented revenue growth from translating proportionately into shareholder earnings.
The real story, therefore, is not simply about flat profit. It is about why a ₹4,397 crore increase in revenue failed to produce a larger PAT.
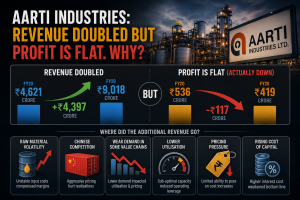
The Revenue-Profit Paradox: A Much Bigger Company With Less Profit
The contrast between FY20 and FY26 becomes much clearer when the focus shifts from absolute revenue to earnings conversion.
| Metric | FY20 (₹ crore) | FY26 (₹ crore) |
| Gross Income/ Revenue | 4,621 | 9,018 |
| EBITDA | 977 | 1,172 |
| PAT | 536 | 419 |
Aarti added ₹4,397 crore to its top line over the period. But EBITDA increased by only ₹195 crore, while PAT declined by ₹117 crore.
The deterioration becomes even more visible at the margin level. Using the figures reported for each period, PAT fell from roughly 11.6% of FY20 gross income to about 4.6% of FY26 revenue, while EBITDA declined from roughly 21.1% to 13.0%.
The important message is not simply that profits grew slowly. The company retained far less of every rupee generated by its larger business.
This is the real revenue-profit paradox. Aarti almost doubled its top line, but the profitability of that expanded revenue base weakened sharply.
The rest of the story, therefore, is about identifying where those lost margins went and which factors are temporary enough to recover versus structural enough to permanently change Aarti’s earnings profile.
FY22 Was Not the True Profit Peak It Appeared to Be
FY22 is the biggest distortion in Aarti Industries’ recent financial history.
The company reported ₹7,919 crore of revenue and ₹1,930 crore of EBITDA for FY22. But those headline numbers included ₹631 crore of termination income from a cancelled contract.
Aarti itself presented the underlying picture separately. Excluding the termination income:
- Revenue was ₹7,288 crore
- EBITDA was ₹1,320 crore
- Profit before tax was ₹917 crore, versus ₹1,527 crore including the termination income.
The difference is critical. ₹1,930 crore was the reported EBITDA figure, but it was not a clean measure of recurring operating earnings. The underlying EBITDA of ₹1,320 crore is the more useful benchmark for understanding Aarti’s normal earnings power.
Even after removing the exceptional income, FY22 was still a strong operating year. Aarti said normalised EBITDA was about 35% higher than FY21.
But the subsequent years exposed the problem. EBITDA fell to ₹1,089 crore in FY23 and ₹984 crore in FY24, showing that the FY22 profitability environment was not sustained.
The true story, therefore, is not that Aarti fell from ₹1,930 crore of normal EBITDA. It is that even after reaching ₹1,320 crore of underlying EBITDA, the company struggled to maintain that level as industry conditions changed.
More Revenue Did Not Always Mean More Underlying Volume Growth
One reason revenue can mislead investors is that chemical companies often report higher sales even when physical business conditions are weak.
Aarti’s Q1 FY27 provides a recent example.
The company reported revenue of ₹2,627 crore, up 41% year-on-year, but management explicitly stated that the revenue increase was primarily driven by higher input prices being passed on to customers. At the same time, volumes of several key products were lower sequentially.
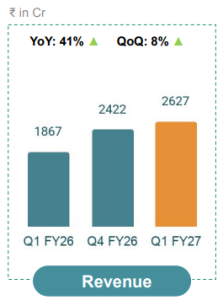
This distinction matters enormously.
If raw-material prices rise and Aarti passes those costs to customers:
Revenue increases → but the value added by Aarti does not necessarily increase proportionately.
The Q1 FY27 presentation also showed that:
- Energy and non-energy volumes were down sequentially.
- The West Asia crisis disrupted supply chains.
- Working capital increased because of higher input prices and exports.
- Higher working capital contributed to higher debt and finance costs.
This explains why investors should look beyond the top line.
A ₹1,000 crore increase in revenue generated through higher prices is fundamentally different from ₹1,000 crore generated through higher volumes, better utilisation and stronger product margins.
Aarti’s revenue growth became bigger than its underlying profit growth partly because not every rupee of additional sales represented additional economic value. To know more, check our latest video.
Where Did the Profitability Go? The Factors Were Not Equally Important
Aarti’s weaker earnings conversion was caused by several factors, but they should not all be treated as equally important.
1. Margin and demand pressure were the biggest operating problem
The most fundamental issue was weaker chemical spreads. Higher revenue could not compensate when selling prices and margins came under pressure across important value chains.
The company has specifically highlighted subdued demand and competitive pressure in products such as PDA and fluorinated chemicals. In Q1 FY27, PDA utilisation was affected by weak US demand and Chinese competition, while fluorinated-product margins remained under pressure because of high competitive intensity.
2. Under-utilisation amplified the margin problem
Aarti’s manufacturing model carries significant fixed costs. When demand weakens, lower capacity utilisation prevents those costs from being absorbed efficiently. This makes volume recovery especially important because higher utilisation can improve profitability even without major price increases.
3. Raw-material volatility complicated pricing
Higher feedstock prices increased revenue when costs were passed through to customers, but pass-through revenue did not necessarily generate proportional profit. Q1 FY27 is a clear example: management said revenue growth was primarily driven by higher input prices passed on to customers.
4. Working capital and finance costs damaged PAT further
Higher input prices and exports increased working-capital requirements, leading to higher debt and finance costs. This explains why an improvement in EBITDA did not always translate fully into PAT.
The hierarchy matters: weak spreads and utilisation hurt operating profitability first; higher working capital and finance costs then reduced what remained for shareholders.
The Bigger Revenue Base Also Required More Capital
The most overlooked part of Aarti’s story is that growth was capital-intensive.
Aarti did not simply sell more products using the same asset base. It invested in capacity, downstream integration and new chemical platforms.
That means the company had to generate sufficient returns not only to cover operating costs but also:
- Depreciation on new assets
- Interest on borrowings
- Working-capital requirements
The Q1 FY27 presentation directly stated that working capital increased because of higher input prices and exports, leading to higher debt and finance costs.
This helps explain why PAT can remain weak even when EBITDA improves.
EBITDA is generated before depreciation and finance costs. PAT is what remains after those costs.
Aarti’s FY26 performance illustrates the difference. The company generated ₹1,172 crore of EBITDA, but PAT was only ₹419 crore.
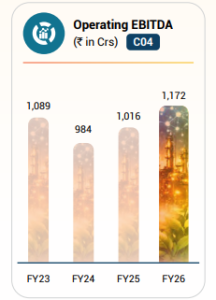
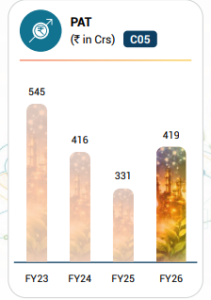
Therefore, the question is not simply whether Aarti can grow EBITDA.
The more important question is:
Can the company generate enough EBITDA from its expanded asset base to produce a meaningful increase in PAT and return ratios?
Until that happens, revenue growth will remain financially less impressive than it appears.
Can Aarti Actually Reach ₹2,200 Crore EBITDA by FY28?
Aarti’s FY28 EBITDA target of ₹1,800-2,200 crore deserves more scrutiny than simply repeating management’s guidance.
Starting from FY26 EBITDA of ₹1,172 crore, the company needs an additional:
- ₹628 crore to reach the lower end of ₹1,800 crore.
- ₹1,028 crore to reach the upper end of ₹2,200 crore.
Management’s own EBITDA bridge identifies three sources of growth:
| Growth Driver | Potential EBITDA Contribution |
| Cost optimisation | ₹150-200 crore |
| Volume and margin ramp-up | ₹350-500 crore |
| Capex-led growth | ₹300-450 crore |
| Total potential | ₹800-1,200 crore |
On paper, the bridge is sufficient. At the low end, the identified ₹800 crore opportunity exceeds the ₹628 crore required to reach ₹1,800 crore. At the high end, ₹1,200 crore exceeds the ₹1,028 crore required to reach ₹2,200 crore.
But the target is not equally dependent on all three drivers.
Cost optimisation can contribute only ₹150-200 crore. The largest portion of the recovery must therefore come from volume, utilisation and margin improvement, together with successful commissioning and ramp-up of new projects.
That makes the FY28 target less of a cost-cutting story and more of an execution story.
The key risk is that Aarti can commission capacity without immediately achieving profitable utilisation. Management has already disclosed delays to Zone IV projects due to labour constraints and war-related issues.
The target is mathematically achievable. The question is whether the company can convert its planned capacity into volumes and margins quickly enough.
The FY28 Target Ultimately Depends on Margin Recovery
The EBITDA target also reveals why revenue growth alone will not be enough.
Aarti generated ₹9,018 crore of revenue and ₹1,172 crore of EBITDA in FY26. To reach ₹1,800-2,200 crore of EBITDA, the company needs to add ₹628–1,028 crore of annual operating profit.
That cannot realistically come from price-led revenue growth alone. Management itself has structured the growth plan around cost savings, volume and margin recovery, and capex-led growth.
The most important variable is therefore the profitability of incremental revenue.
If Aarti grows revenue but continues to operate with weak chemical spreads, the expanded business will not generate enough EBITDA to reach the upper end of the target. Conversely, higher utilisation and margin recovery could produce significant operating leverage because the company already has substantial manufacturing infrastructure in place.
This is why investors should focus less on whether Aarti’s revenue continues rising and more on three questions:
- Are existing plants operating at higher utilisation?
- Are margins recovering across the DCB, NCB, PDA and other major value chains?
- Are new projects generating EBITDA after commissioning?
The FY28 guidance is therefore not fundamentally a prediction about how large Aarti’s revenue will become.
It is a prediction that Aarti can make its existing and new revenue base significantly more profitable than it is today.
The Investor Verdict
There is evidence that Aarti Industries’ earnings are recovering.
FY26 EBITDA rose to ₹1,172 crore, up from the previous year, while PAT reached ₹419 crore. Q1 FY27 showed further improvement, with EBITDA of ₹385 crore and PAT of ₹155 crore.
But investors should be careful about declaring victory too early.
Part of the Q1 FY27 improvement came from product and geography optimisation, monetisation of low-cost inventory and foreign-exchange gains. These are helpful, but they do not by themselves prove that Aarti’s structural margin problem has been solved.
The turnaround will be more convincing if four numbers improve consistently:
- EBITDA margin: The clearest measure of whether additional revenue is becoming more profitable.
- Volume growth and capacity utilisation: Especially across value chains affected by weak demand and Chinese competition.
- Working capital and debt: Revenue growth that continuously consumes cash can weaken shareholder returns.
- EBITDA delivery against the FY28 bridge: Investors should track whether the promised ₹150-200 crore of cost savings, ₹350-550 crore of volume/margin gains and ₹300-450 crore of capex-led growth are actually appearing in reported earnings.
Aarti’s recovery is therefore no longer just a management promise but it is not yet a completed turnaround either.
The next phase will determine whether FY26 and Q1 FY27 mark the beginning of a sustainable profit recovery or simply an improvement from a weak base.
For investors, the thesis is now straightforward: don’t just watch revenue growth. Watch whether Aarti can finally make every additional rupee of revenue meaningfully more profitable.